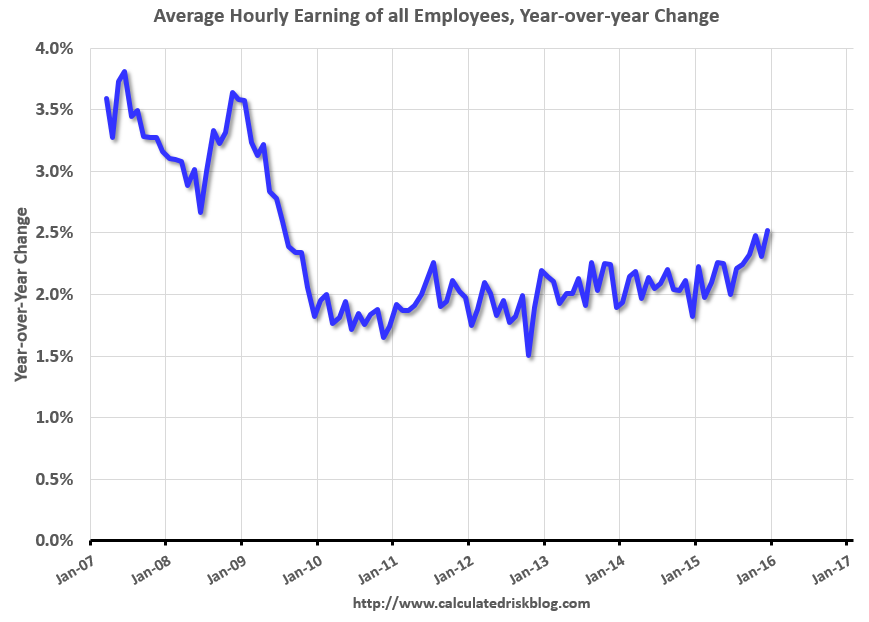
Calculated Risk is an excellent blog for economic news: http://www.calculatedriskblog.com The sky is always falling, but here is a good trend from
A case for $5 oil…
From the Economist: http://www.economist.com/node/188181 Oh, wait, this is from 1999!: "Yet here is a thought: $10 might actually be too
The Domino Effect
RBN Energy is probably the best blog on US energy fundamentals ... And now Rusty Braziel has a book
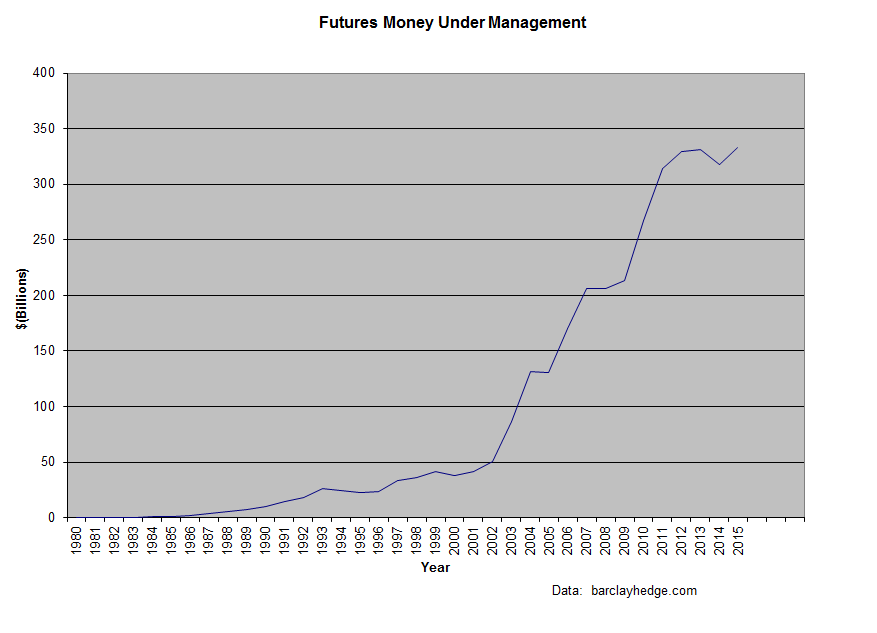
Assets under management, CTA’S
Here is a chart of assets under management for CTA's (commodity trading advisors) from barclayhedge.com... BarclayHedge is an excellent site for fund
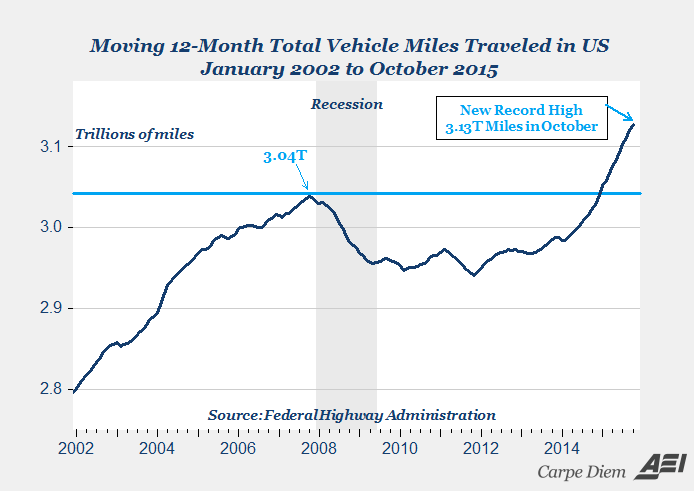
Total Vehicle Miles, via Carpe Diem
The chart is from Carpe Diem,(https://www.aei.org/publication/monday-morning-links-28/)...
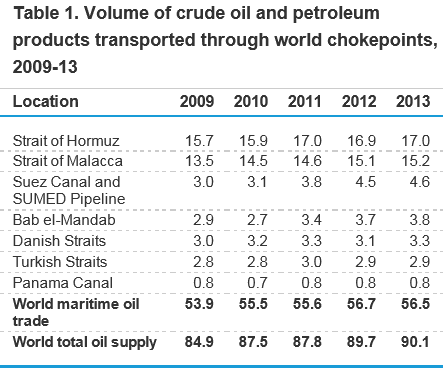
World Oil Transit Chokepoints, EIA
From the EIA, November 2014: http://www.eia.gov/beta/international/analysis_includes/special_topics/World_Oil_Transit_Chokepoints/wotc.pdf "Located
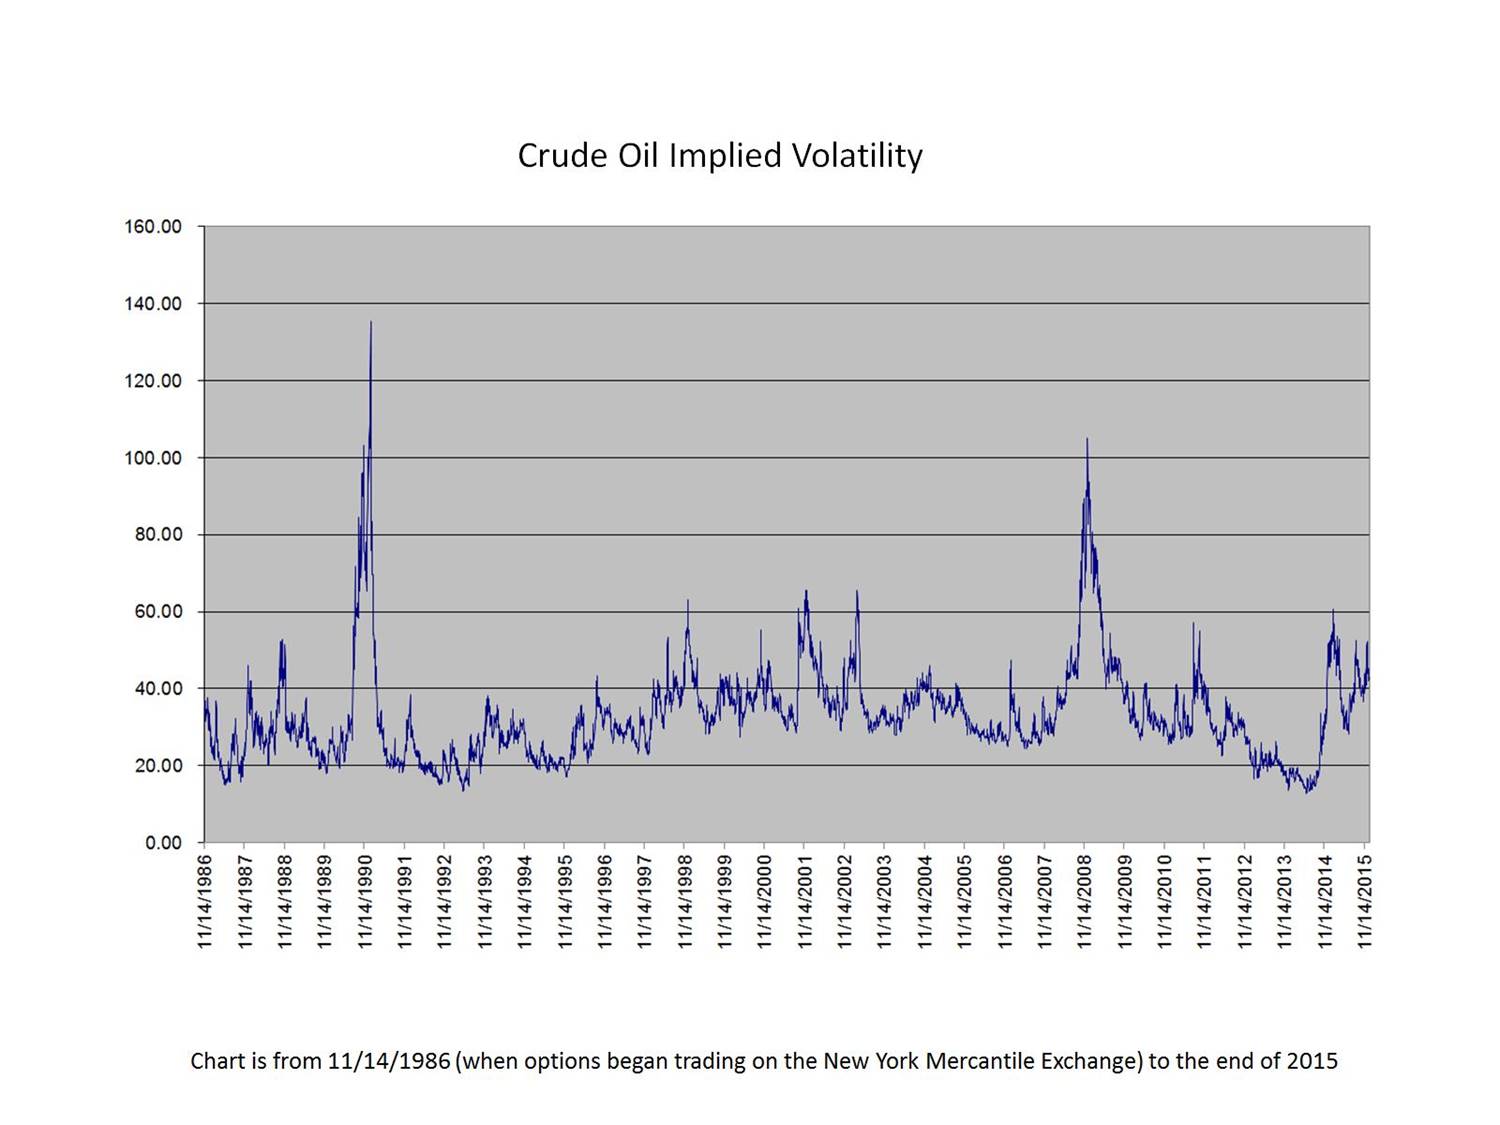
Crude Oil Implied Volatility (historical perspective)
Here is the all time implied vol chart for WTI since options began trading on November 14, 1986... The long term average is 32.9, with a high of 135.4
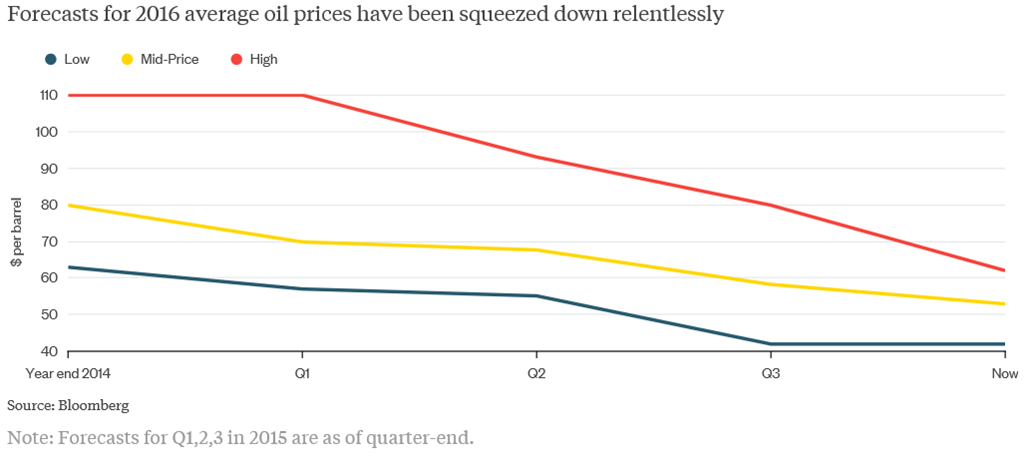
Oil Forecasters Aim High… from Bloomberg
The difficulty in predicting oil prices a year ahead is clear, as this Bloomberg chart shows... In January 2015's Short Term Energy Report (STEO),
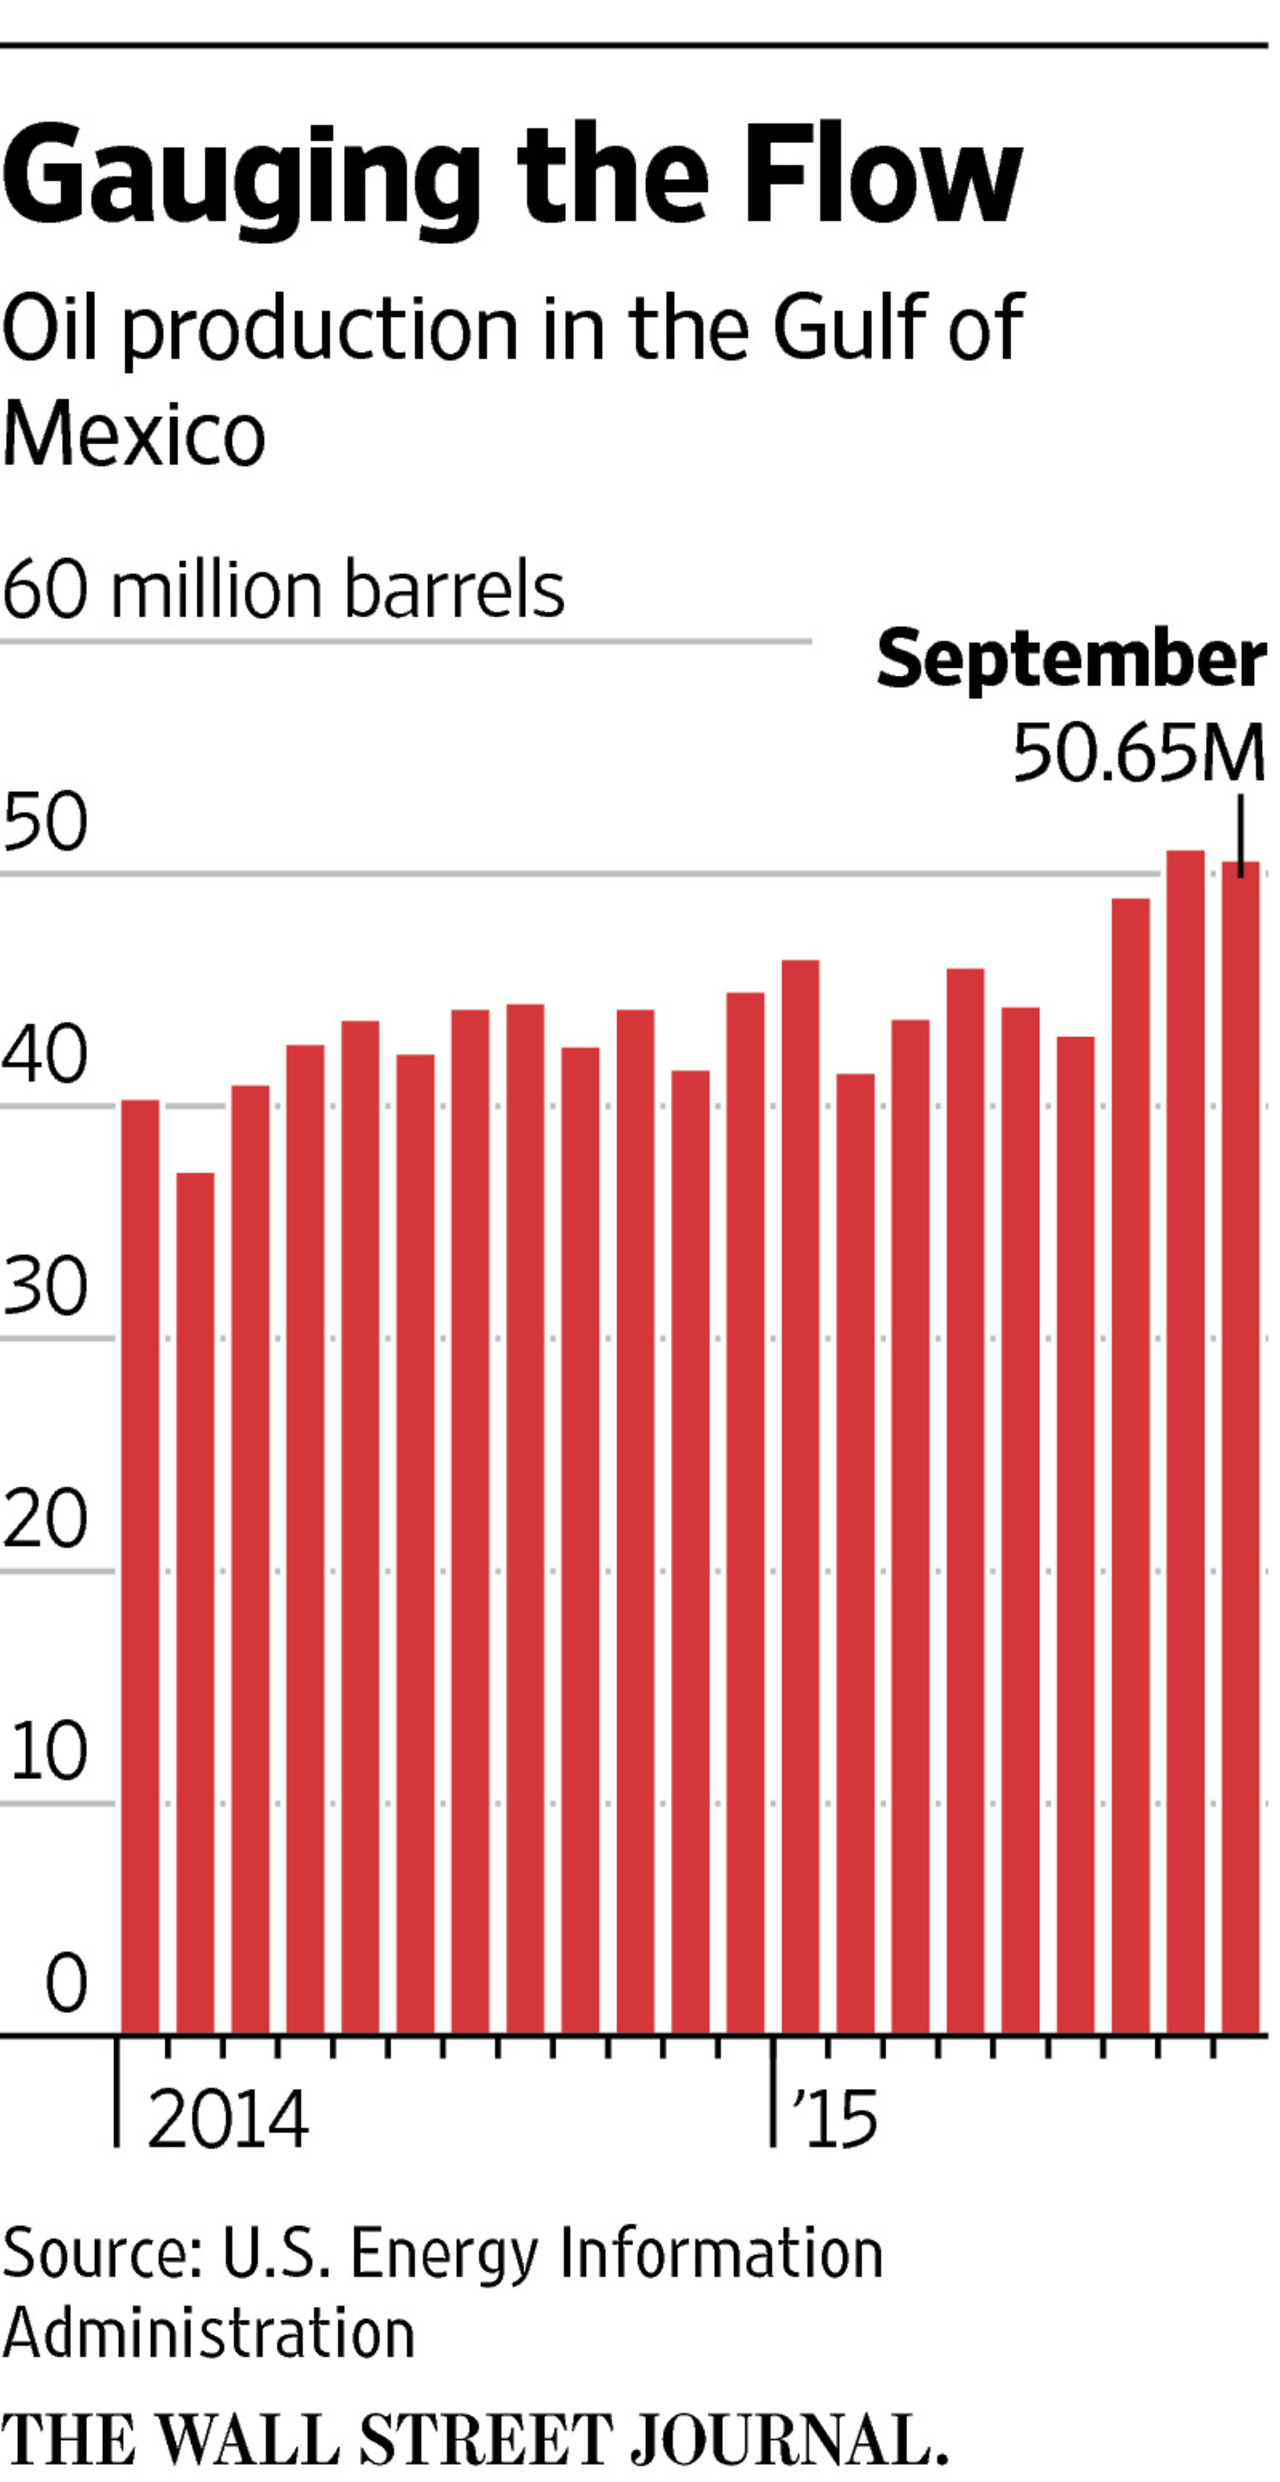
As Oil Keeps Falling, Nobody Is Blinking….WSJ
Here is a very nice article in Today's Wall Street Journal which mentions the sharp increase in oil production from the Gulf of