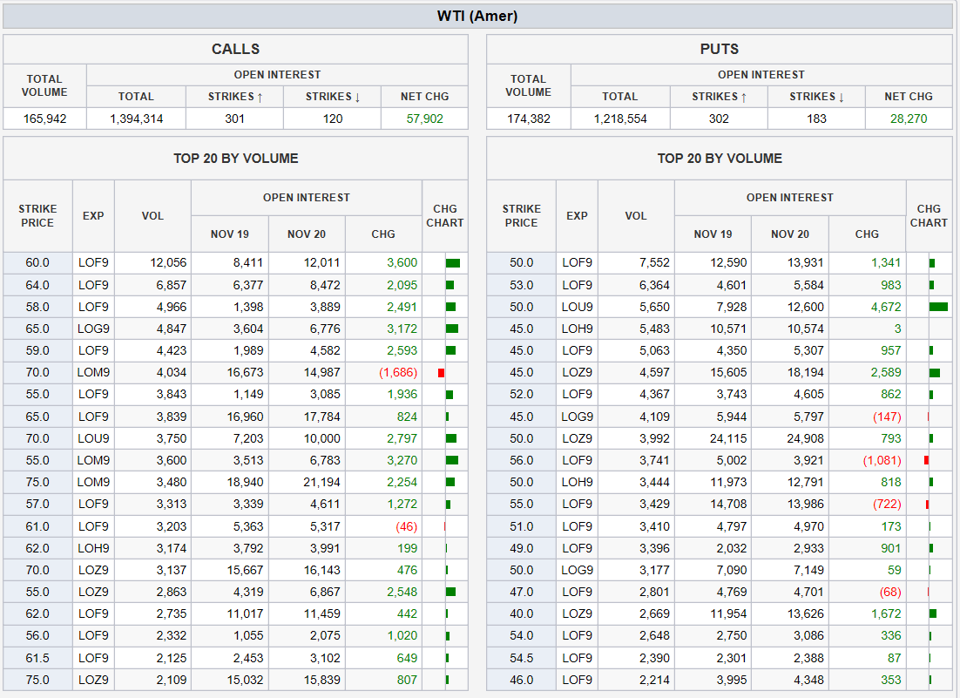
Yesterday's crude oil options' volume was heavy with over 340,324 trading... Prices settled sharply lower, implied vol was up 12.3, to 48.8, based on
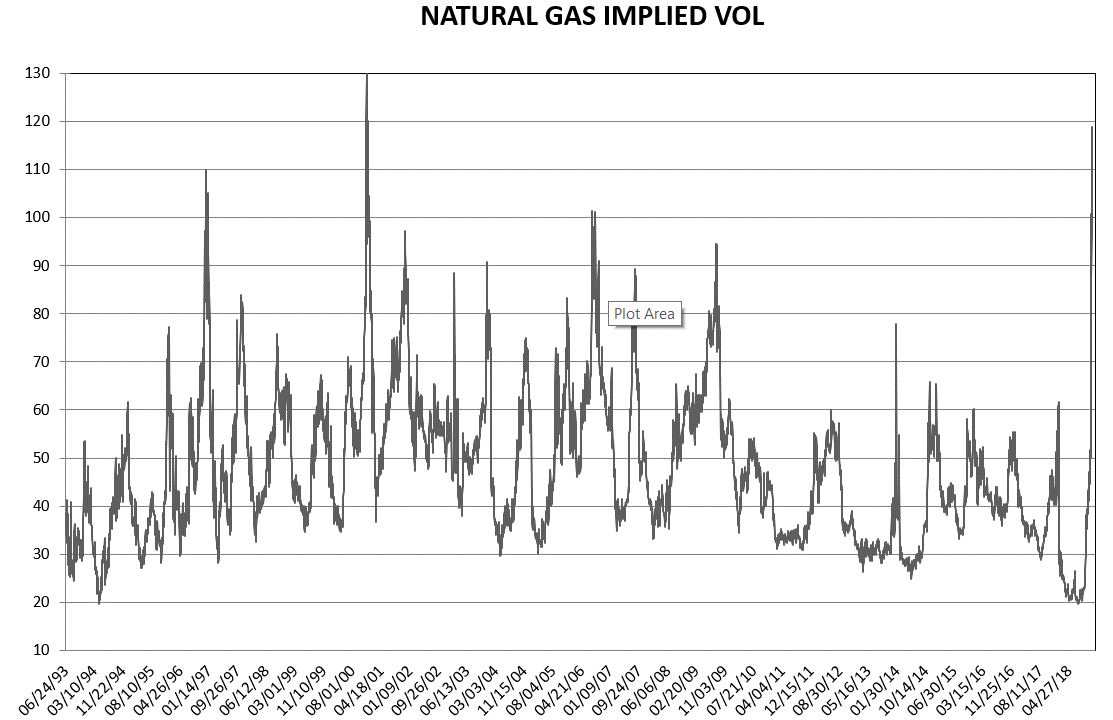
Natural gas volatility is back!
Here is the long term chart of at the money implied vols for natural gas using the second nearby option:
Investors hit by natgas swings… Reuters
My bias is toward buying options... Here is Reuters describing what happened to a company actually called OptionSellers.com in the natural gas
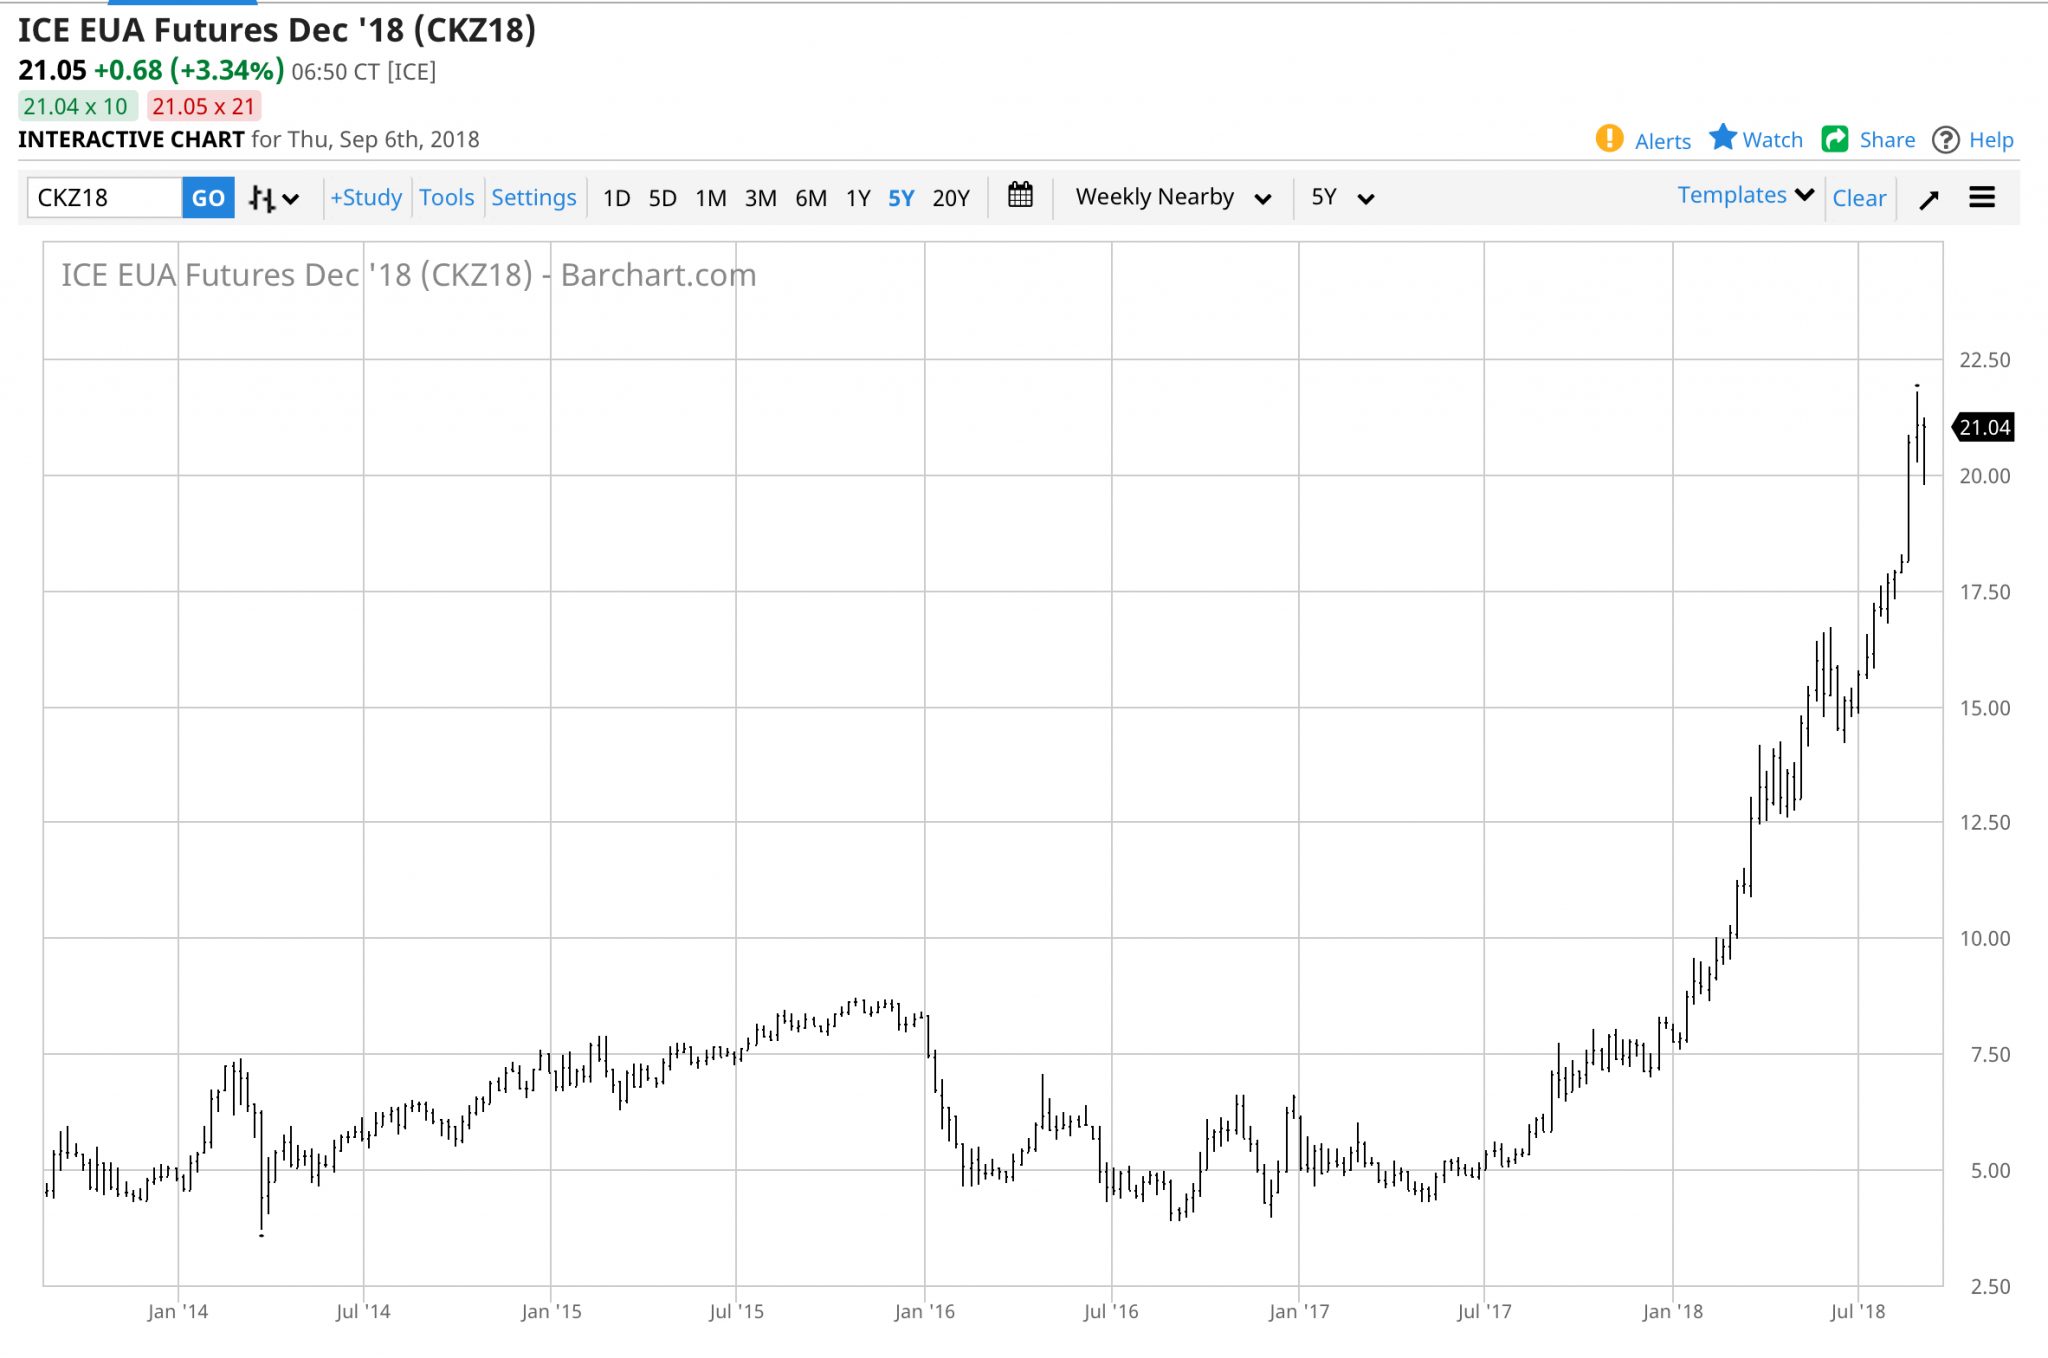
ICE CO2 Allowance Futures/update…
Updating an old post: Here is the chart, from Barchart.com: Reuters has this: ”Carbon permits traded under the EU’s
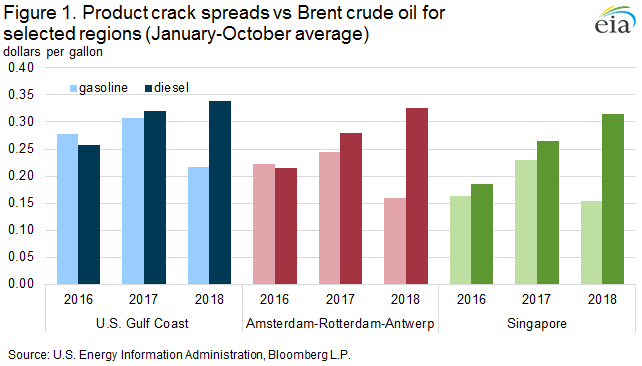
Gasoline vs. diesel cracks.. EIA
Gasoline vs. diesel crack spreads from the EIA’s This Week in Petroleum, here... “Gasoline crack spreads (the price difference between crude oil
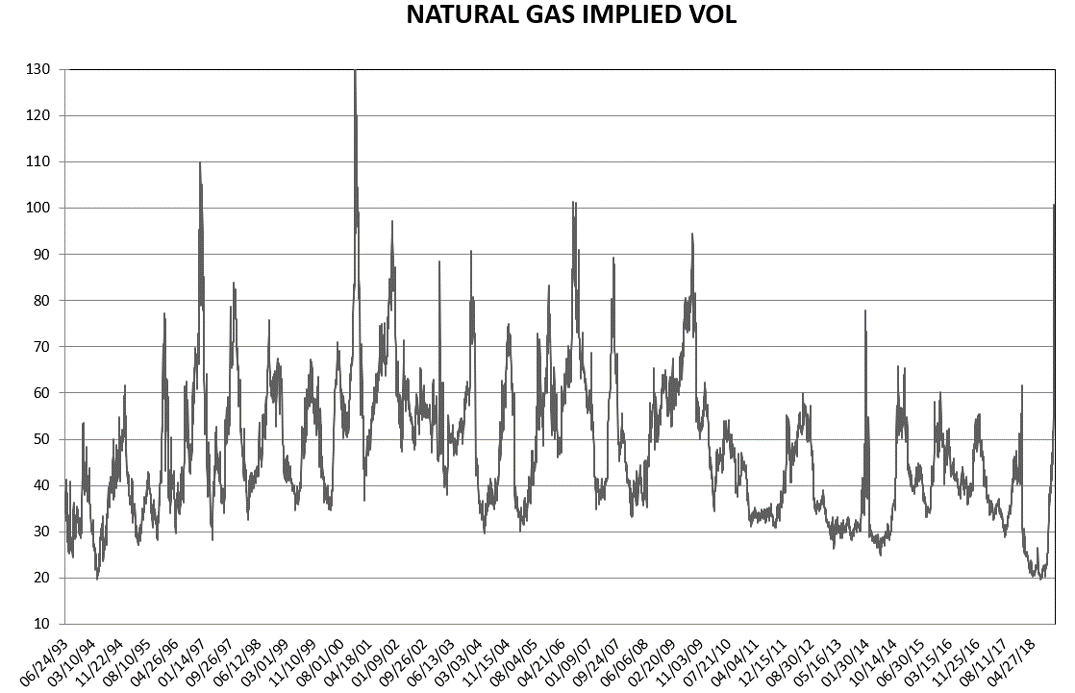
Long term natural gas implied vol chart…
This is my own data series based on at the money options, using the second nearby option... January settled at 100.8 yesterday:
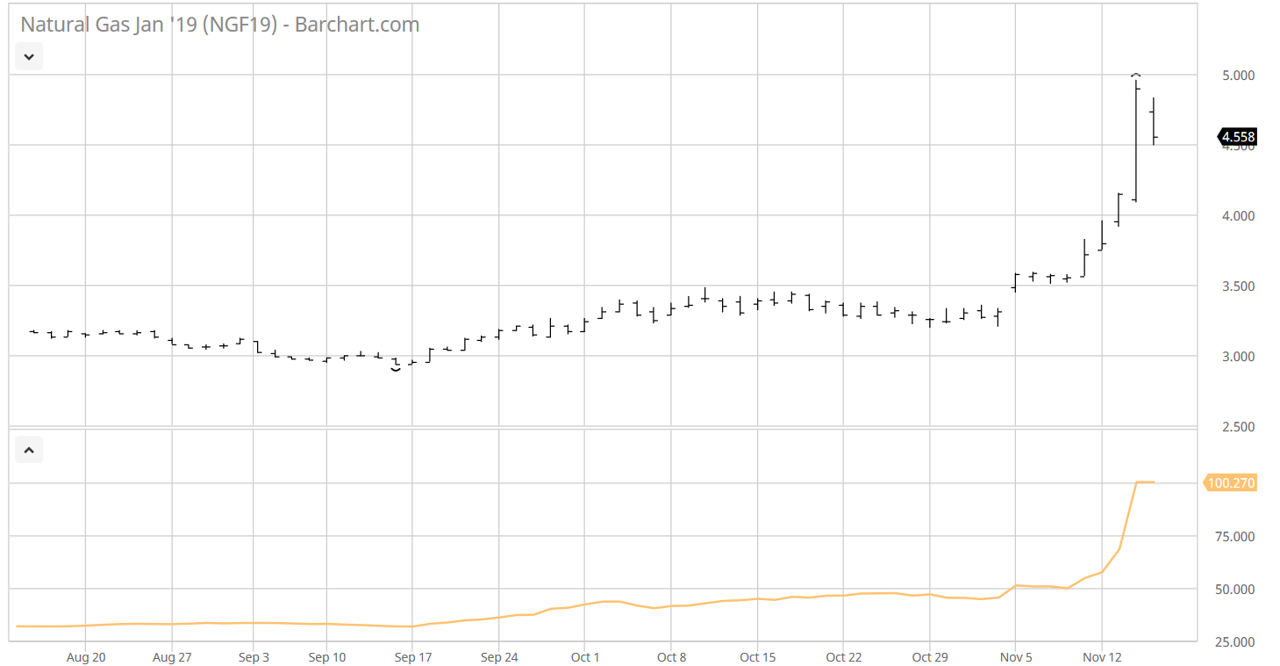
Natural gas implied vol hits 100…
Here is a snapshot from barchart.com which shows implied volatility settling at 100.3 for the Jan contract!
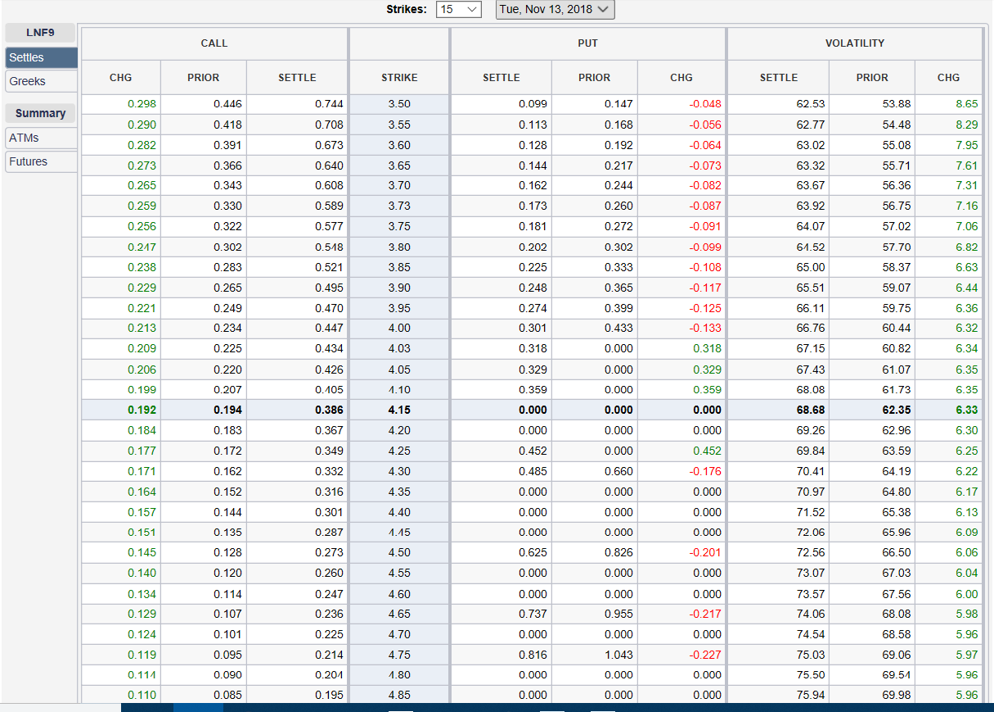
A tale of two skews…
Natural gas and crude oil prices are moving in opposite directions... in a hurry... Implied vol for both have moved up sharply, with natural gas
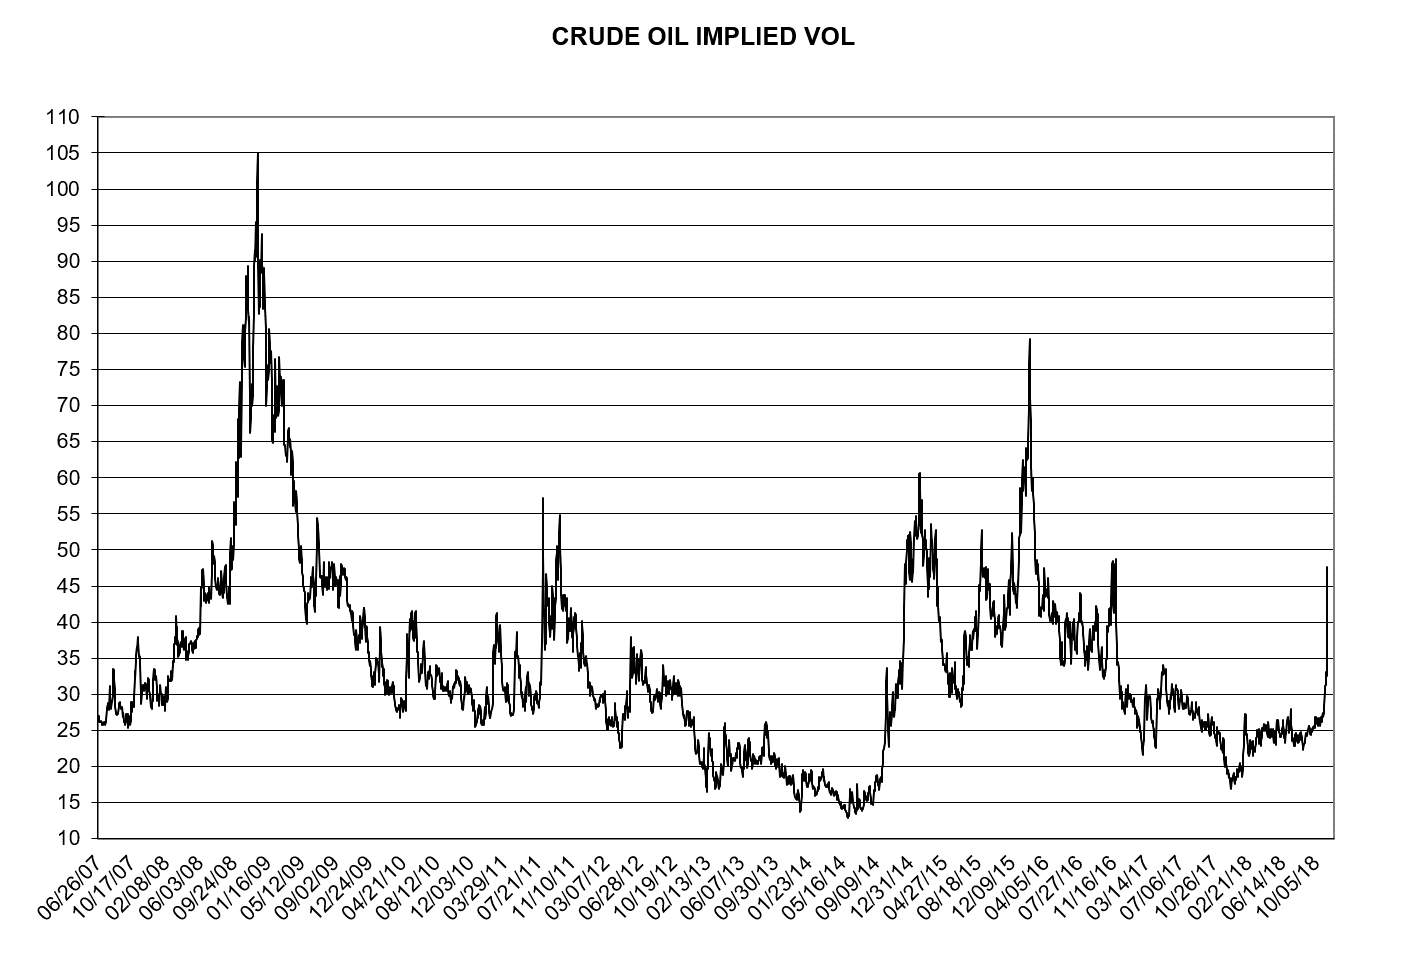
Updated vol chart, WTI…
Implied volatility shot higher yesterday... This chart uses settlement data from at the money, second month options...