
From the EIA’s Today in Energy, here is a look at US petroleum consumption:
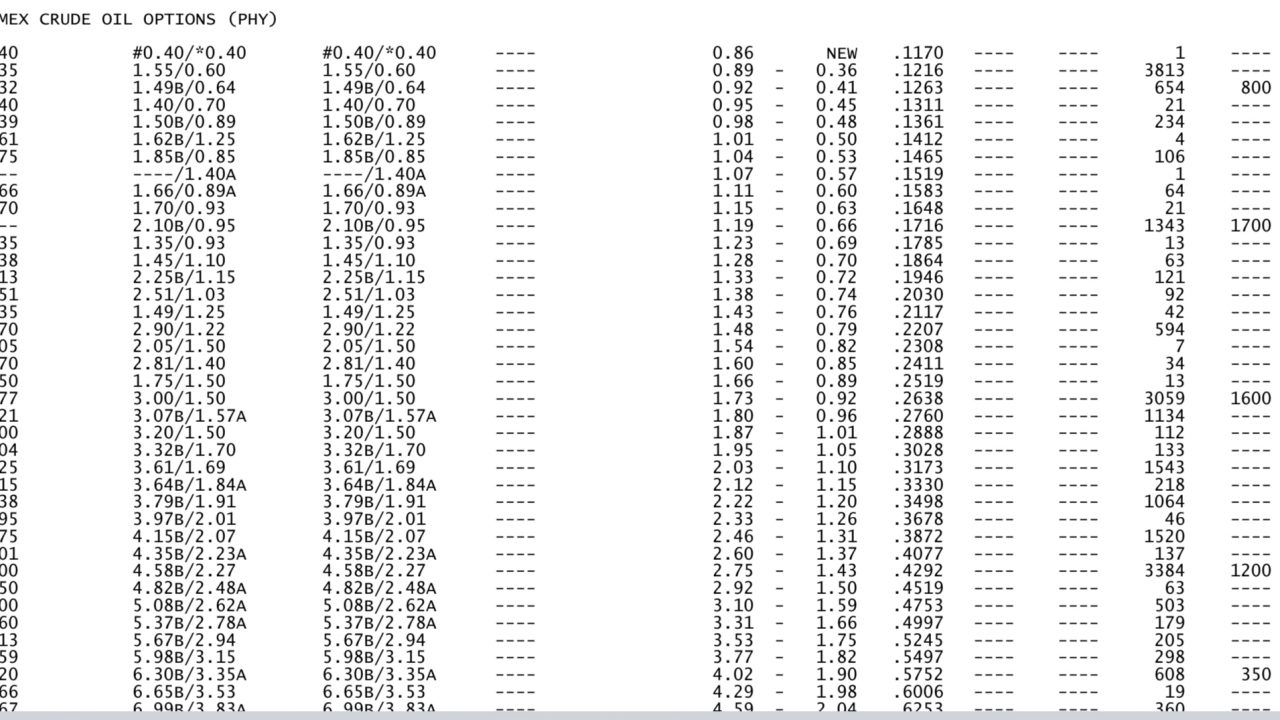
June $O puts trade…
So far, the lowest struck put that traded is the June $0 put (and only one lot)... The buyer has the right to sell crude oil for...nothing! Settled at
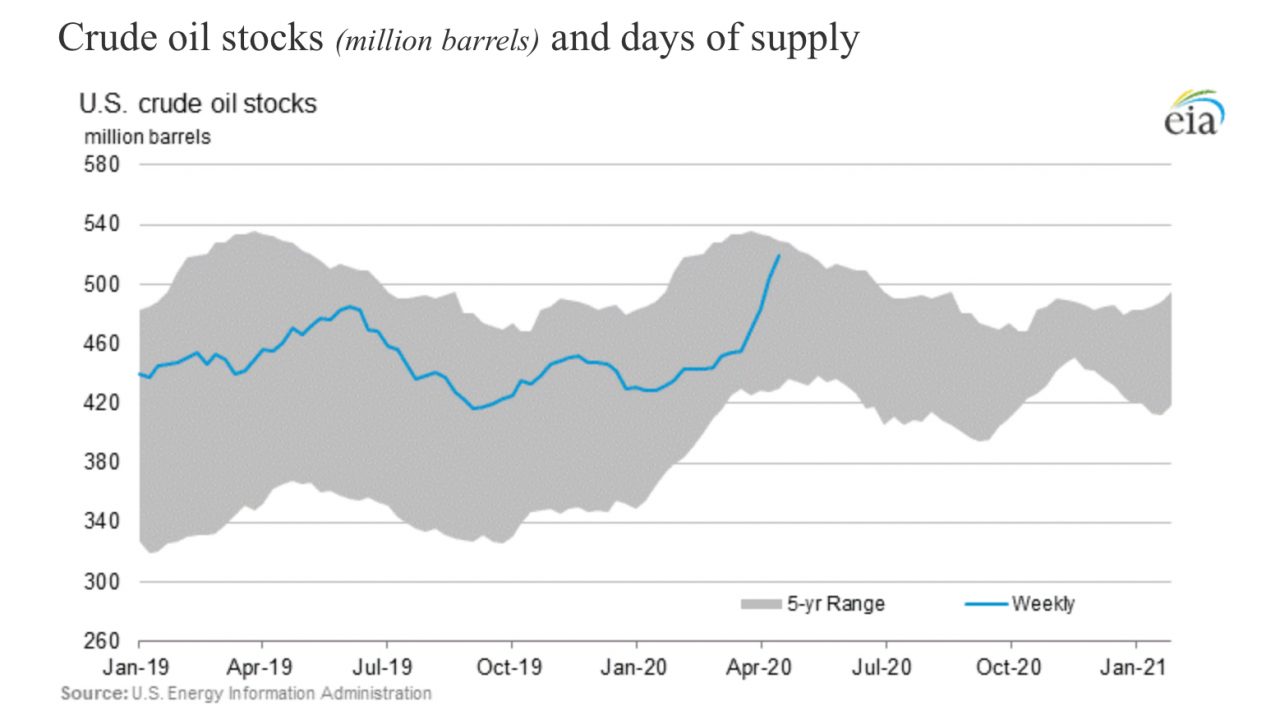
US Oil stocks… EIA
Here are some charts from the EIA’s This Week in Petroleum showing stock levels compared to 5 year ranges and demand (days supply):
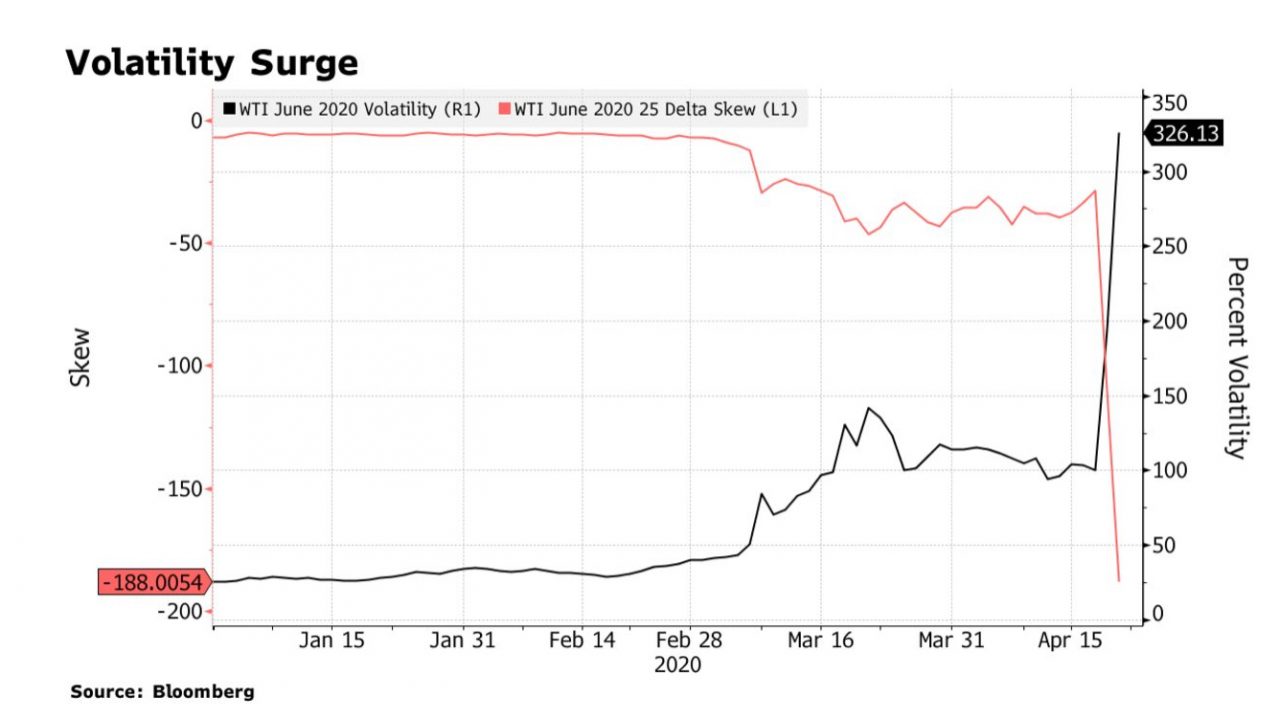
Traders, CME switch models… Bloomberg
Alex Longley, Jack Farchi and Catherine Ngai, Bloomberg, write about market participants changing pricing models to account for negative oil prices,
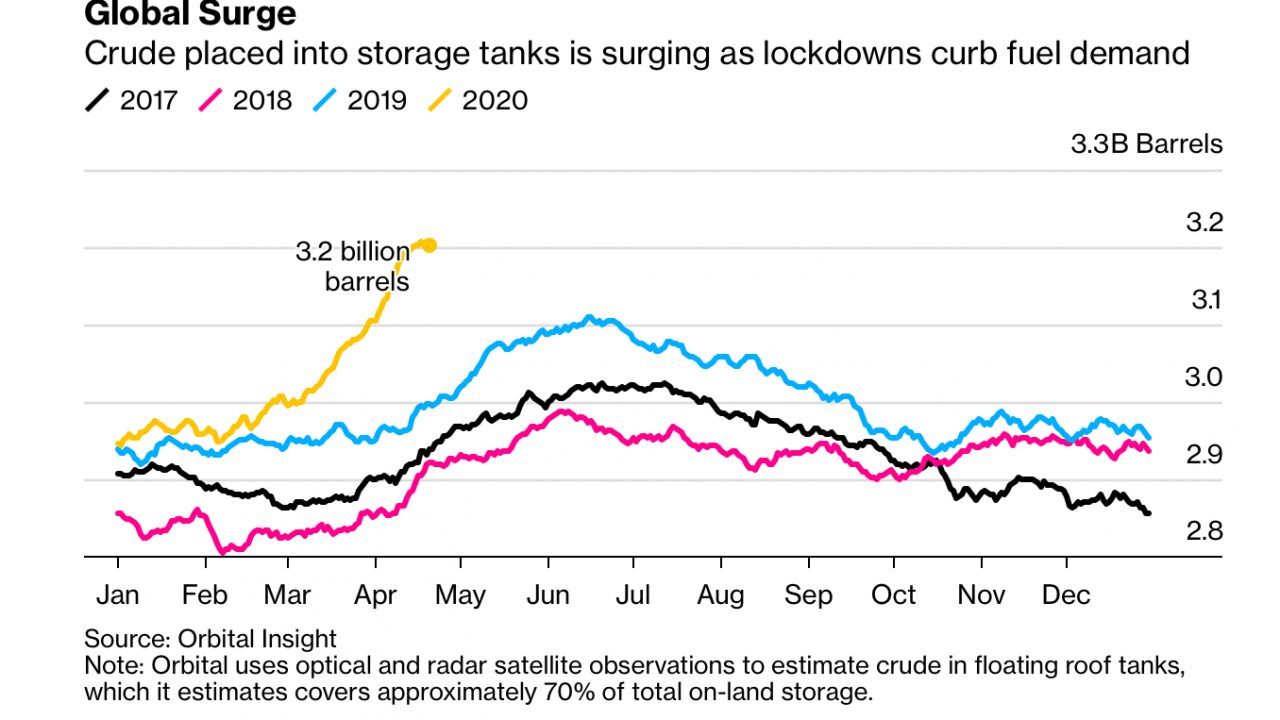
Storage filling up…Bloomberg
Sharon Cho and Alex Longley, Bloomberg, display a nice chart showing global oil stocks surging, here...
US Oil ETF… WSJ
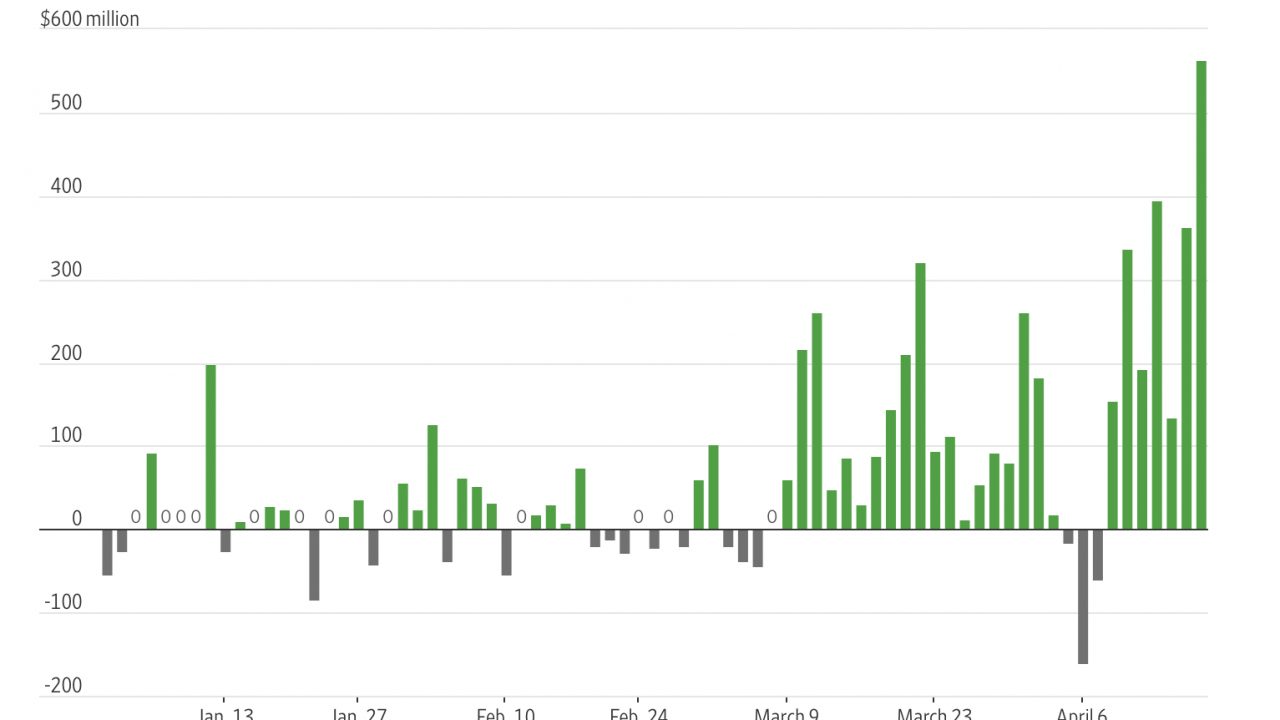
Amrith Ramkumar, Wall Street Journal, has a nice piece on the US Oil Fund, here... ”Roughly $5 billion has flowed into the U.S. Oil Fund this year,
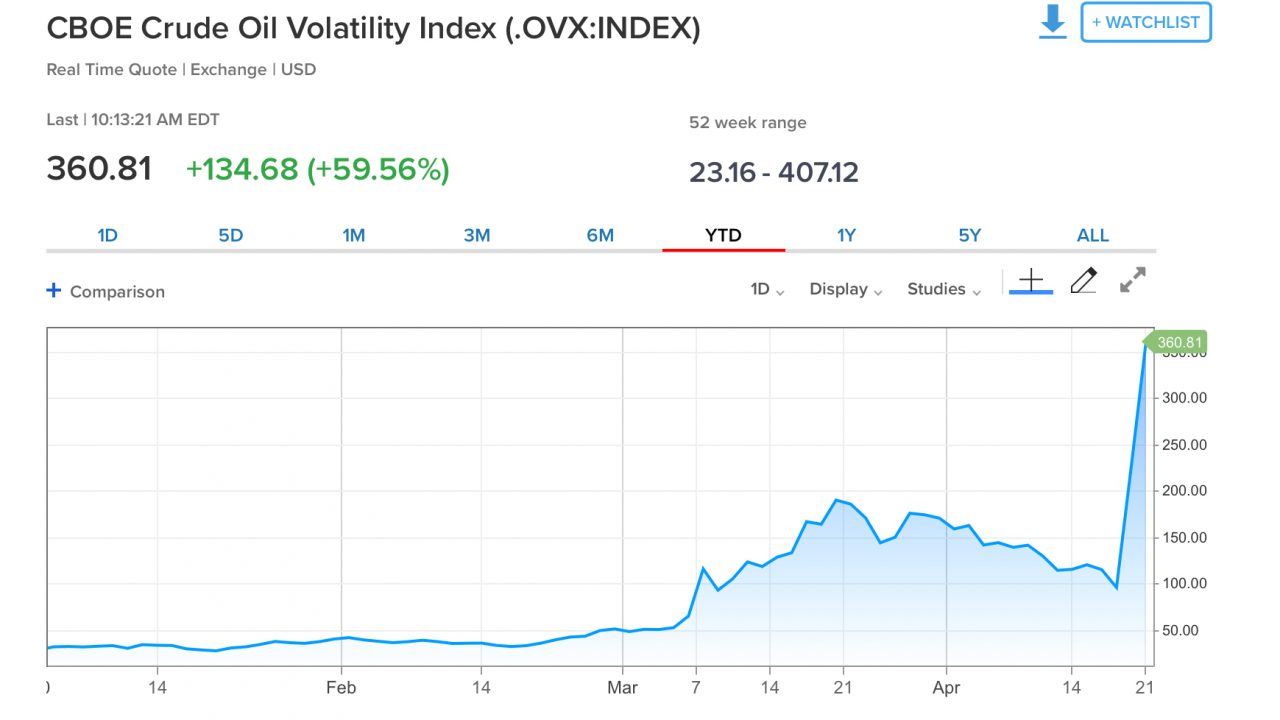
June WTI vol explodes…
The CME’s Option Settlement Tool shows June implied vol settling at 216.3, +96!!! 224,518 puts traded to 82,821 calls... This is what happens when
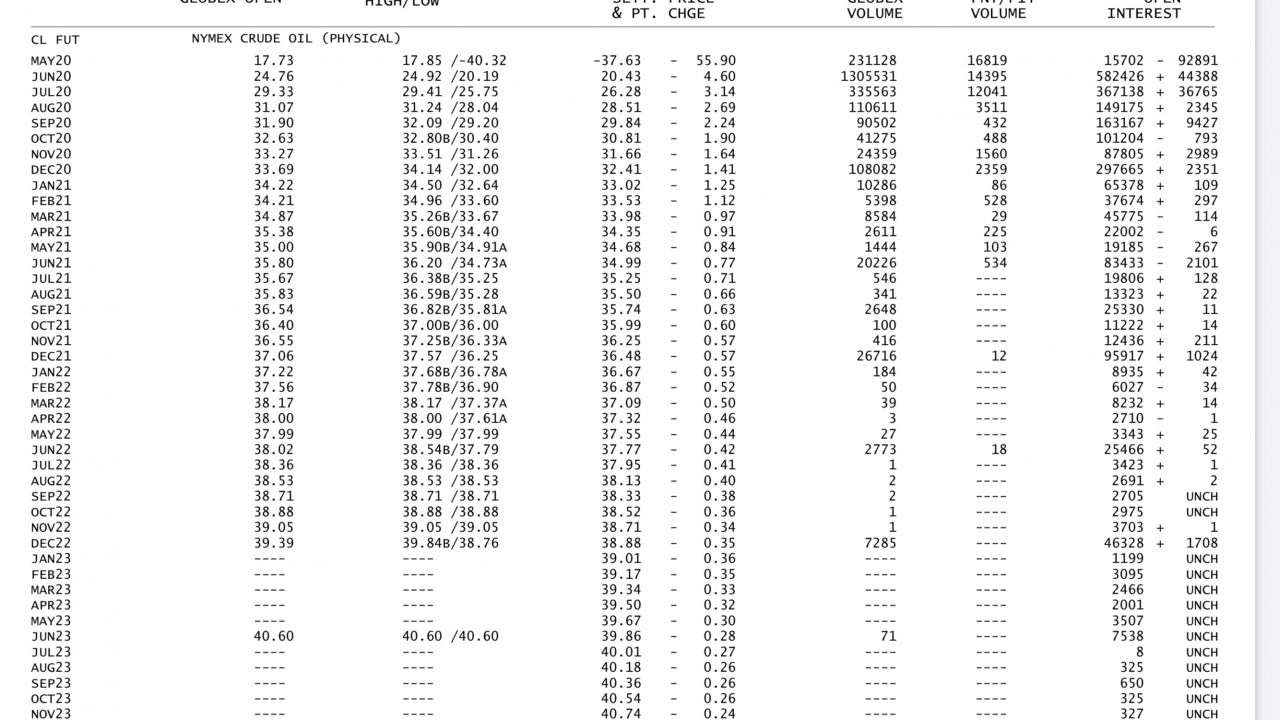
May CL open interest drops..
Going into the last day of trading, May CL crude open interest is at 15,702, -92,891... This is based on the CME’s Daily Bulletin,
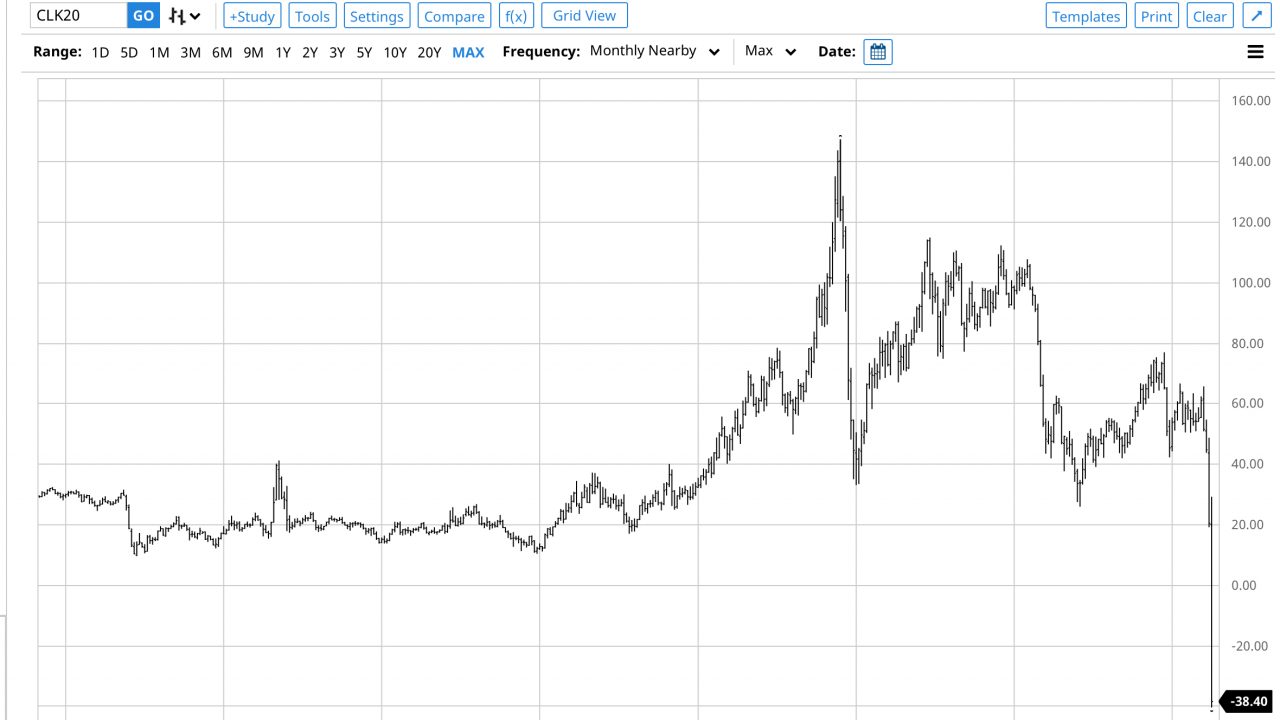
Long term oil chart all messed up…
Here is a long term chart of WTI oil including today’s record low, sharply minus price: