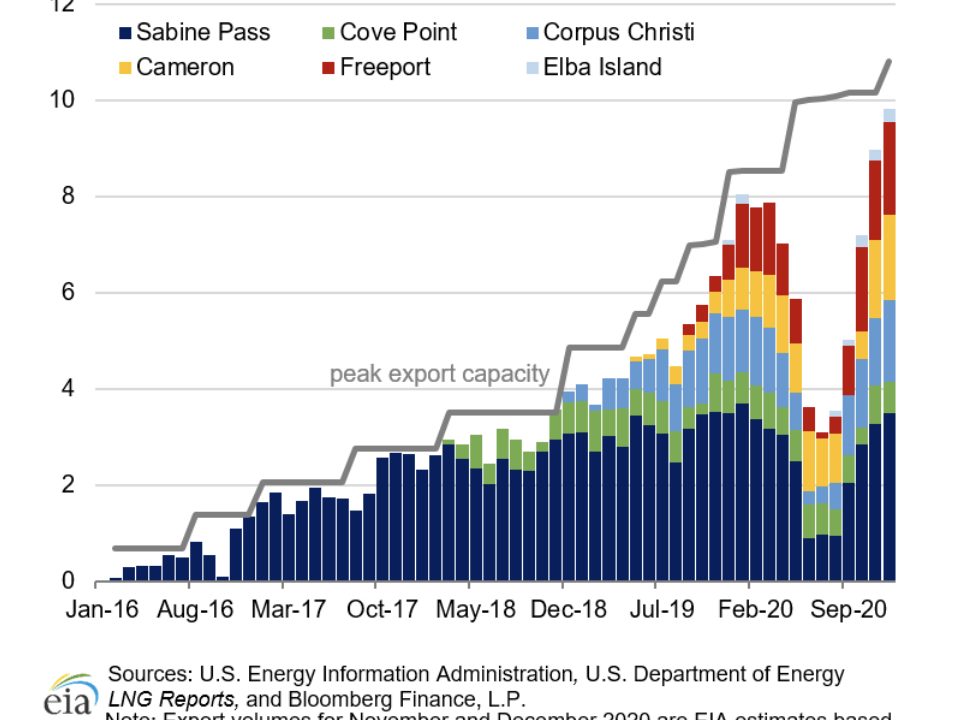
This is from the EIA’s Natural Gas Weekly Update: ”U.S. exports of liquefied natural gas (LNG) set a new record in December after a record-breaking
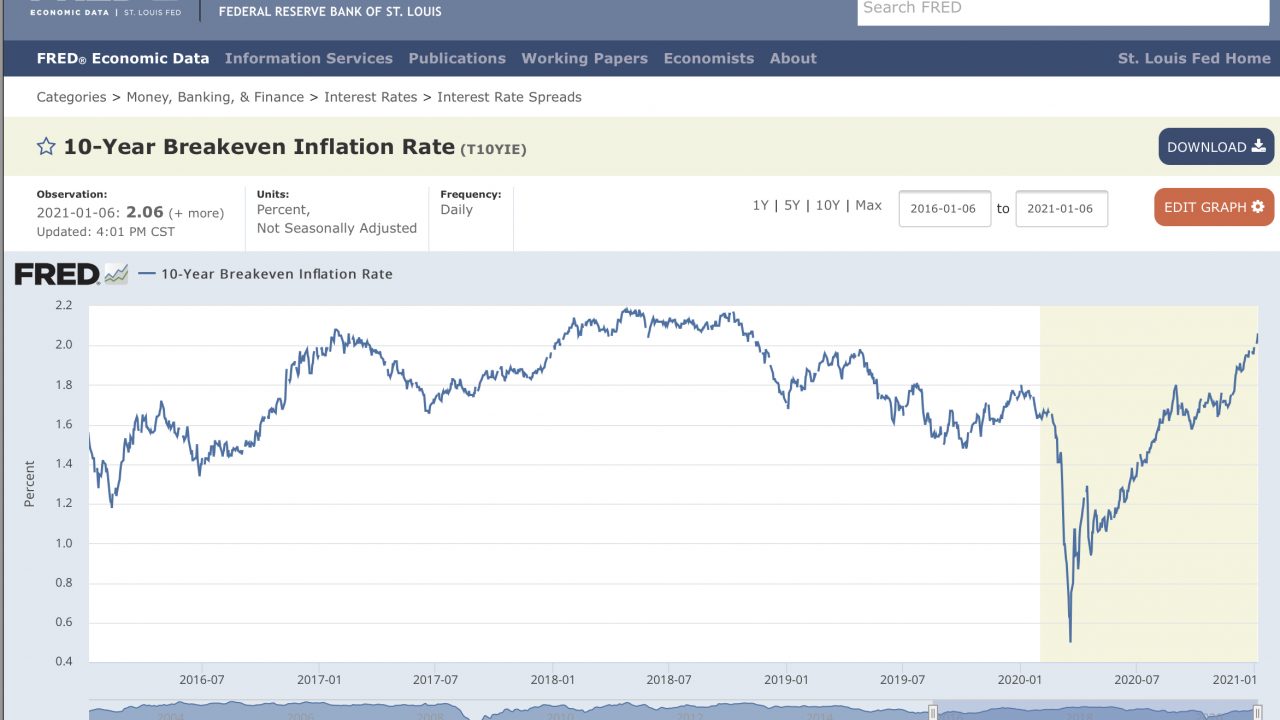
10-Year Breakeven Inflation Rate… St. Louis Fed
What even more stimulus expected with a Democratic controlled government looks like, from FRED:
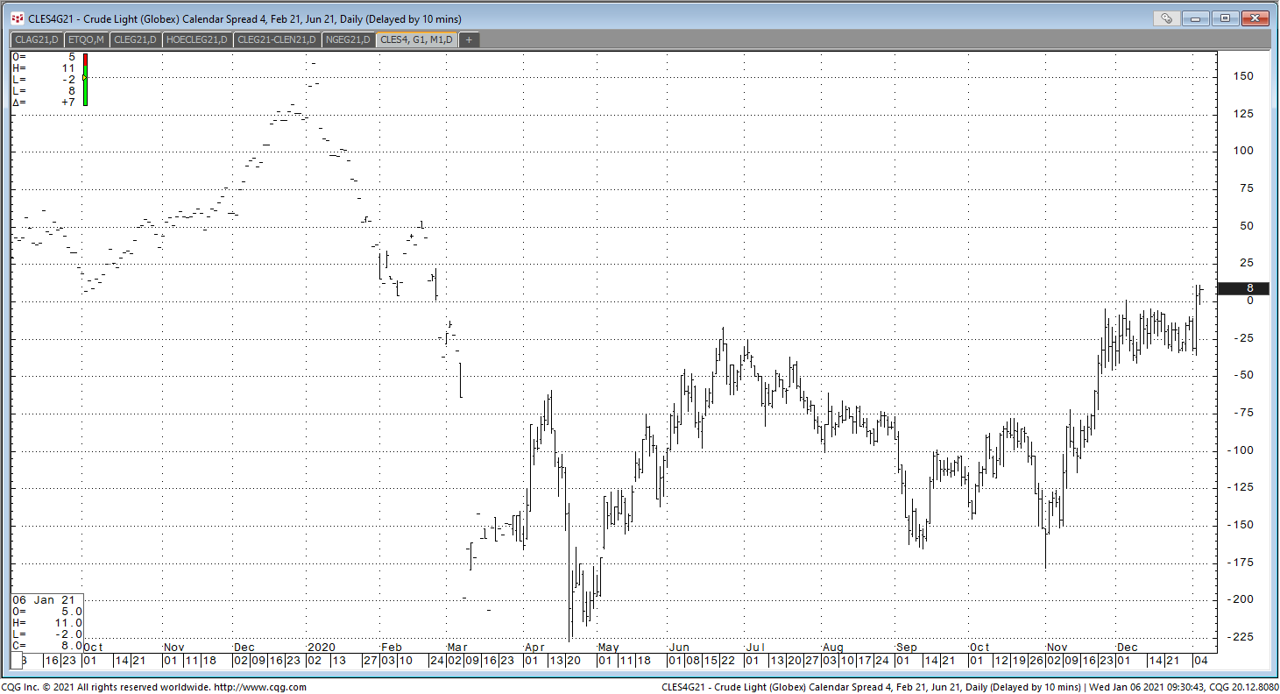
Feb/June WTI chart… CQG
Feb/June WTI spread moved over the zero level yesterday into backwardation... A million barrel cut in oil production by Saudi Arabia will do that!
John Kemp updates fund activity in oil… Reuters
John Kemp, Reuters, adds a couple of interesting charts to his always excellent recap of fund activity in oil markets, here...
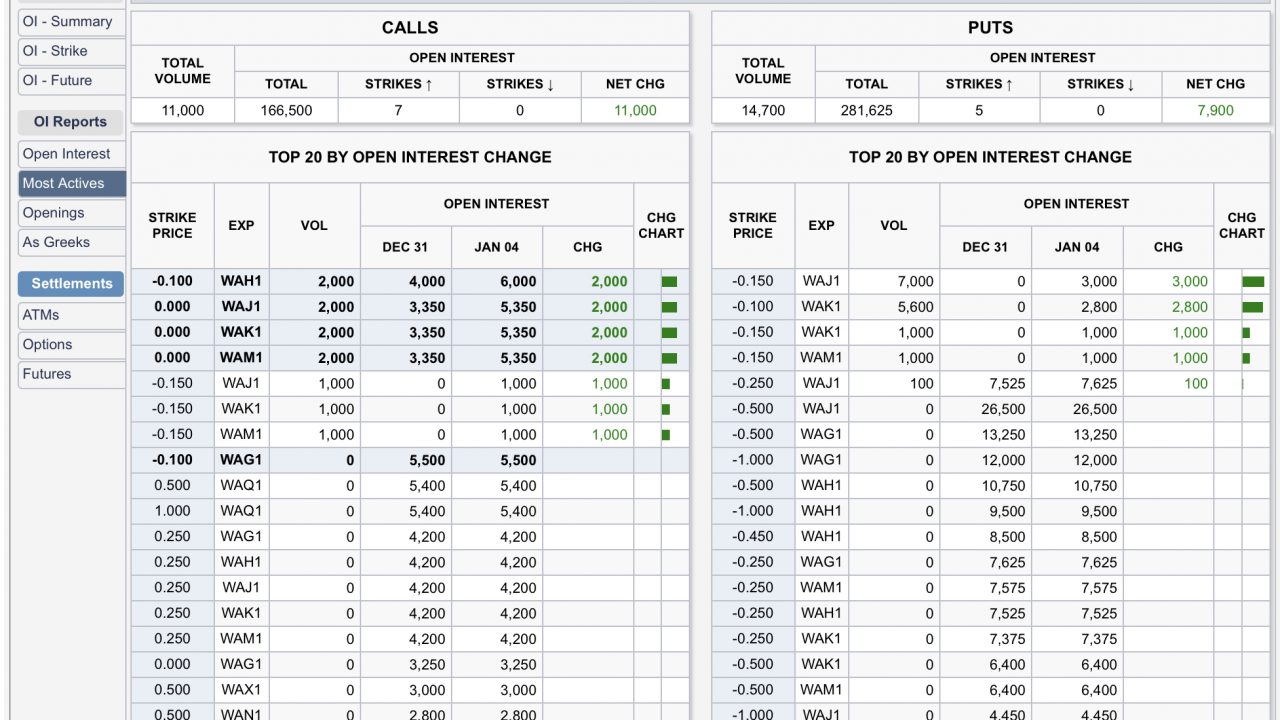
Oil CSO’s were active yesterday…
From the CME, here are the one month calendar spreads that traded yesterday... The actual spreads didn’t move much...
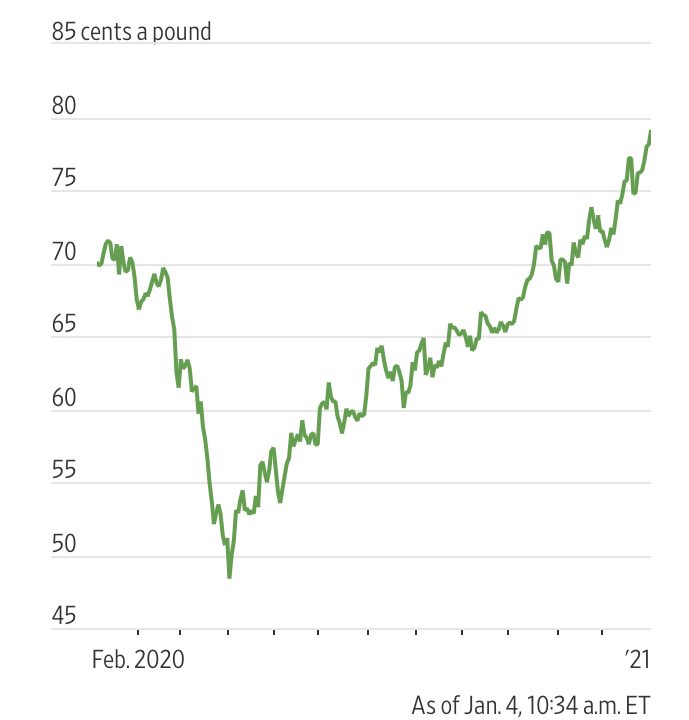
Cotton prices rally… WSJ
Kirk Maltais, Wall Street Journal, writes about cotton, here... “Cotton prices have risen to their highest level in nearly two years thanks to dry

Long term vol chart for WTI…
After a most volatile year in crude oil, implied volatility for WTI settled at 34.6 on 12/31/2020... The long term average going back to the
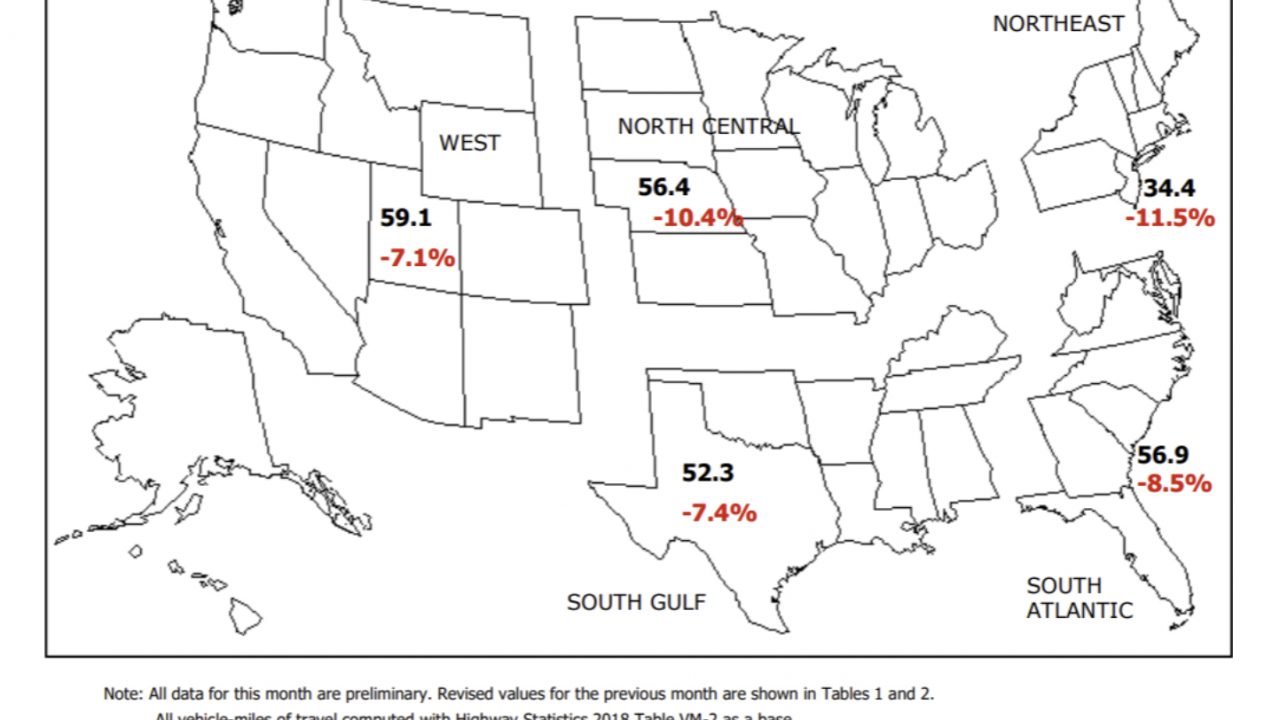
Vehicle miles traveled… Advisor Perspectives
Jill Mislinski, Advisor Perspectives, tracks vehicle miles traveled using DOT data (through October):

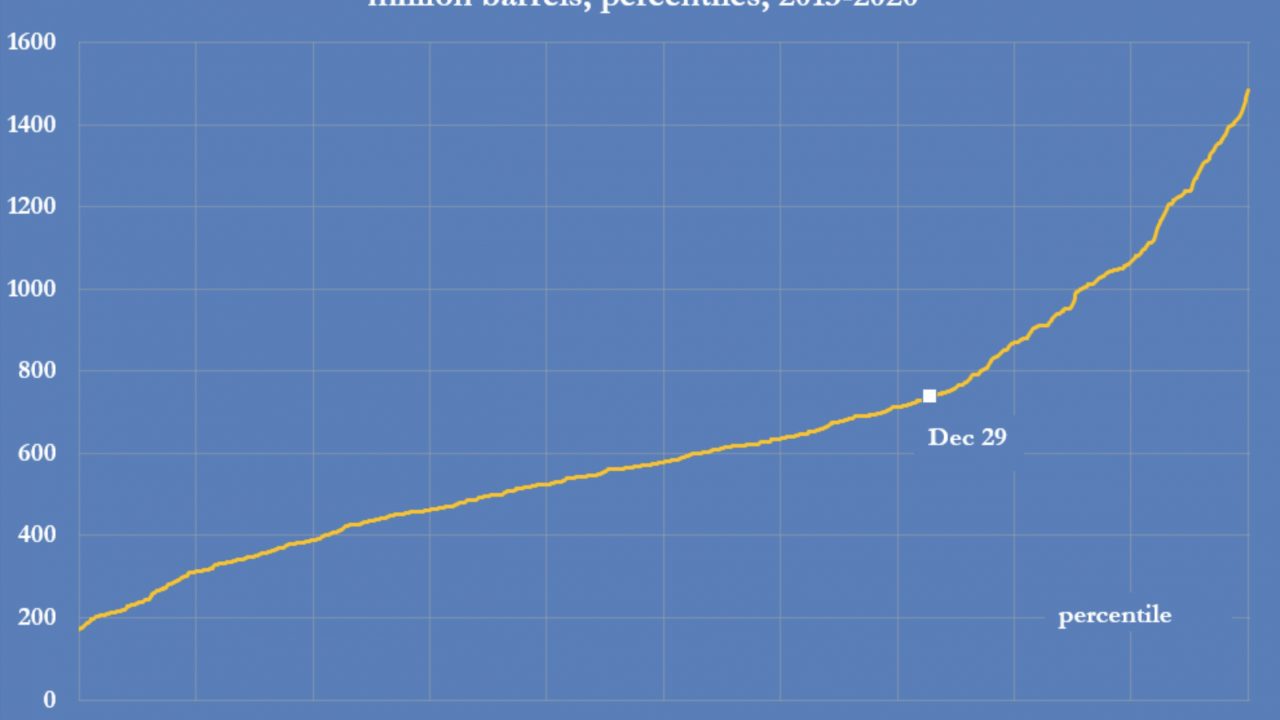
Oil stocks, days supply… EIA
From the EIA’s This Week in Petroleum here is a look at stock levels and days supply (stocks/daily demand) for crude, distillates and gasoline...