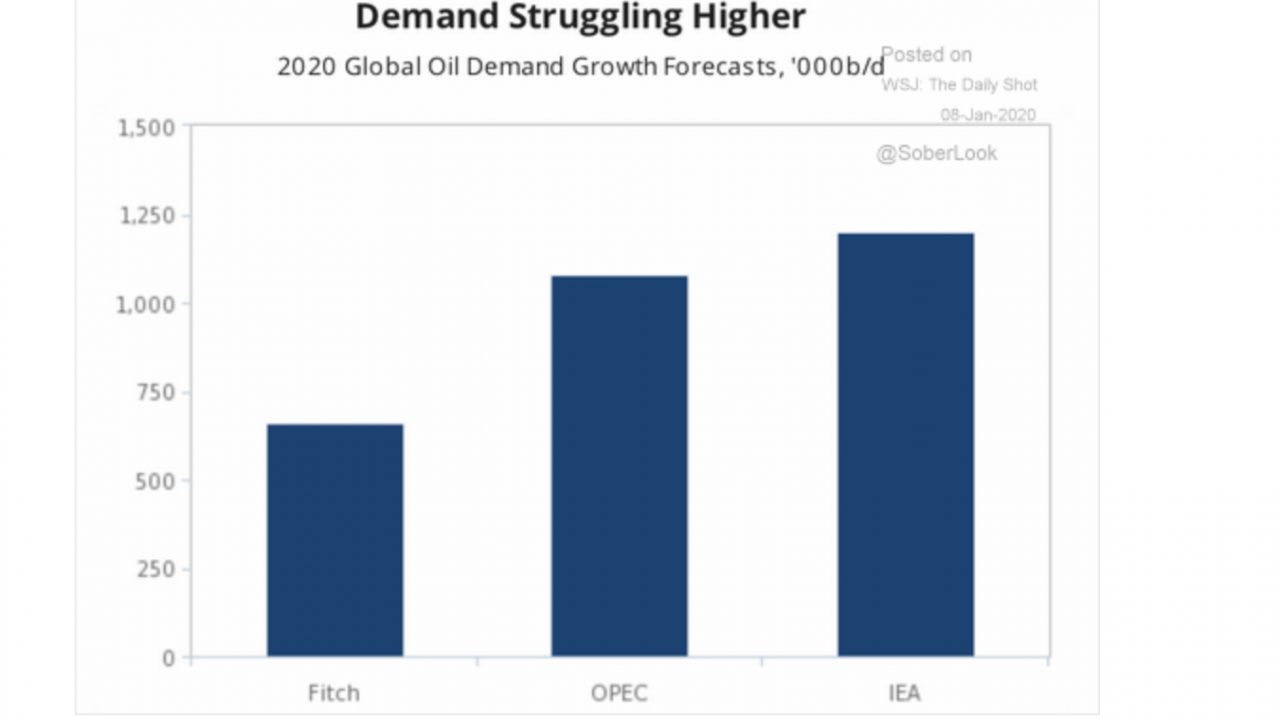
The Wall Street Journal put out a chart showing demand expectations for 2020... The U.S’s Energy Information Administration (EIA) is at +1.4... The
Barry Ritholtz on learning from mistakes… Bloomberg
Barry Ritholtz, Bloomberg and The Big Picture, writes about what one can learn about investing from mistakes, here... Here is a good one: Always
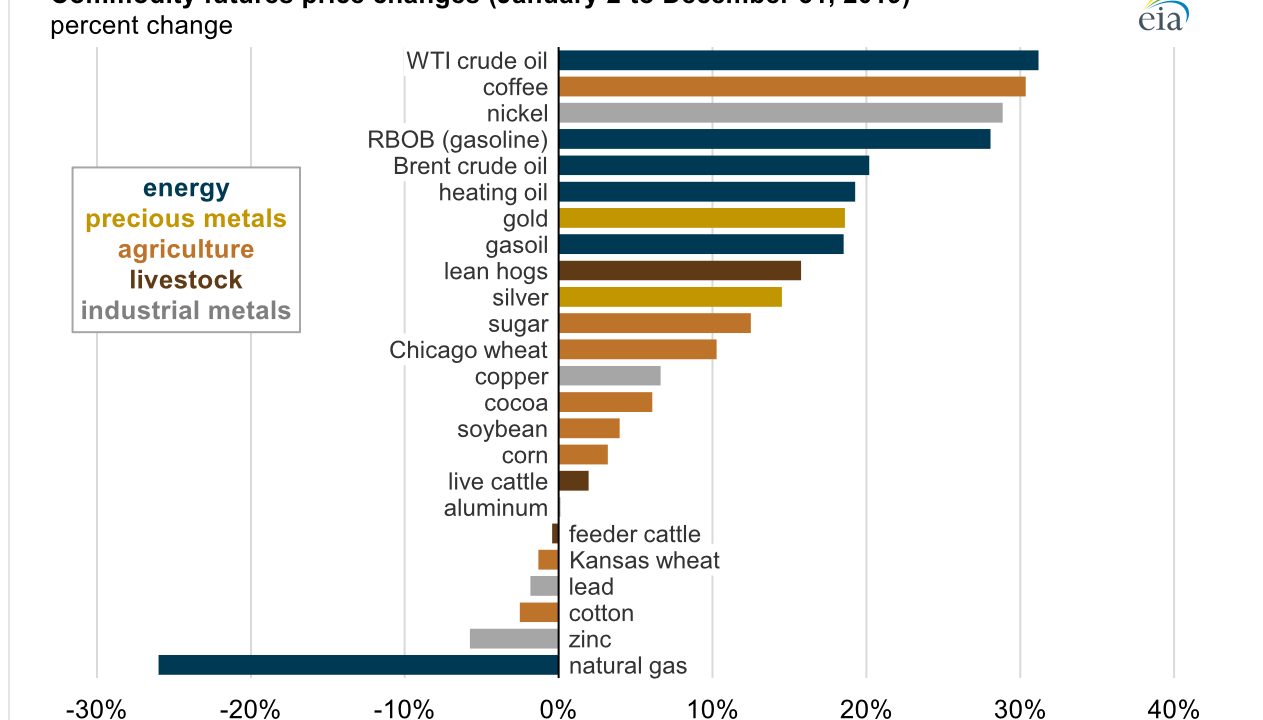
Energy commodity prices rise more than others… EIA
The U.S. Energy Information Agency looks at commodity prices for the year, here...
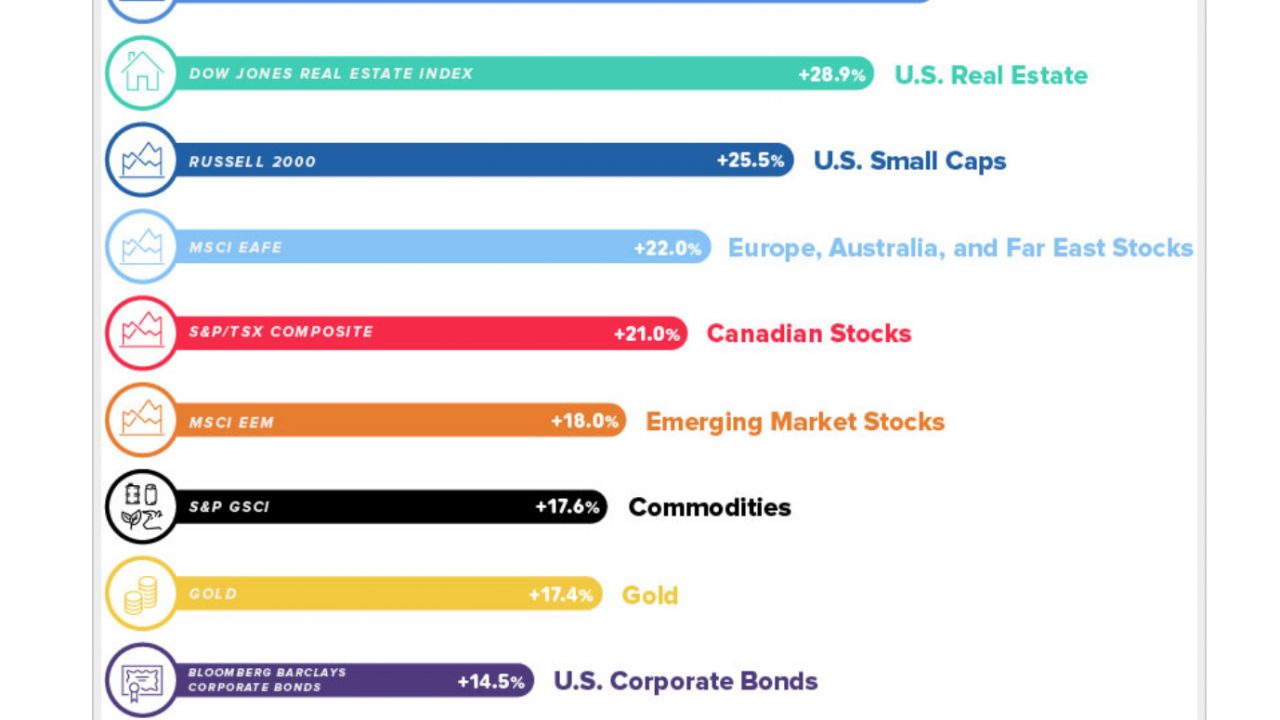
Asset class performance, 2019… The Big Picture
The chart is from Visual Capitalist via The Big Picture, here... I’m looking for the investment return “quilts” which should be out later this
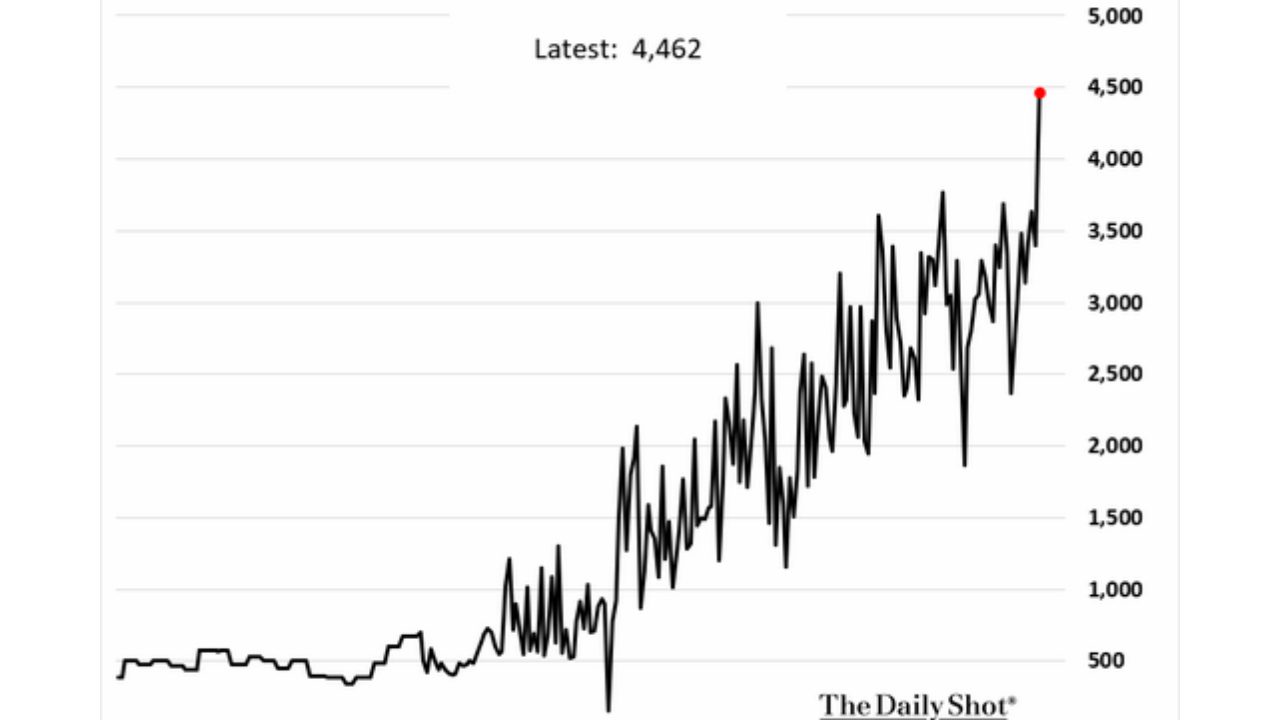
U.S. oil exports…. WSJ
We’ll watch the EIA’s Weekly Petroleum Status Report to see if the most recent number is sustained... Here is the Wall Street Journal with the
Thomas Friedman on Soleimani… NYTimes
Do read the whole thing here...

Yesterday’s action in WTI options…
Implied vol moved higher on yesterday's sharp price move, but not by much... Feb settled at 26.9 +2.5, March, 26.8 +2.0 based on at the money
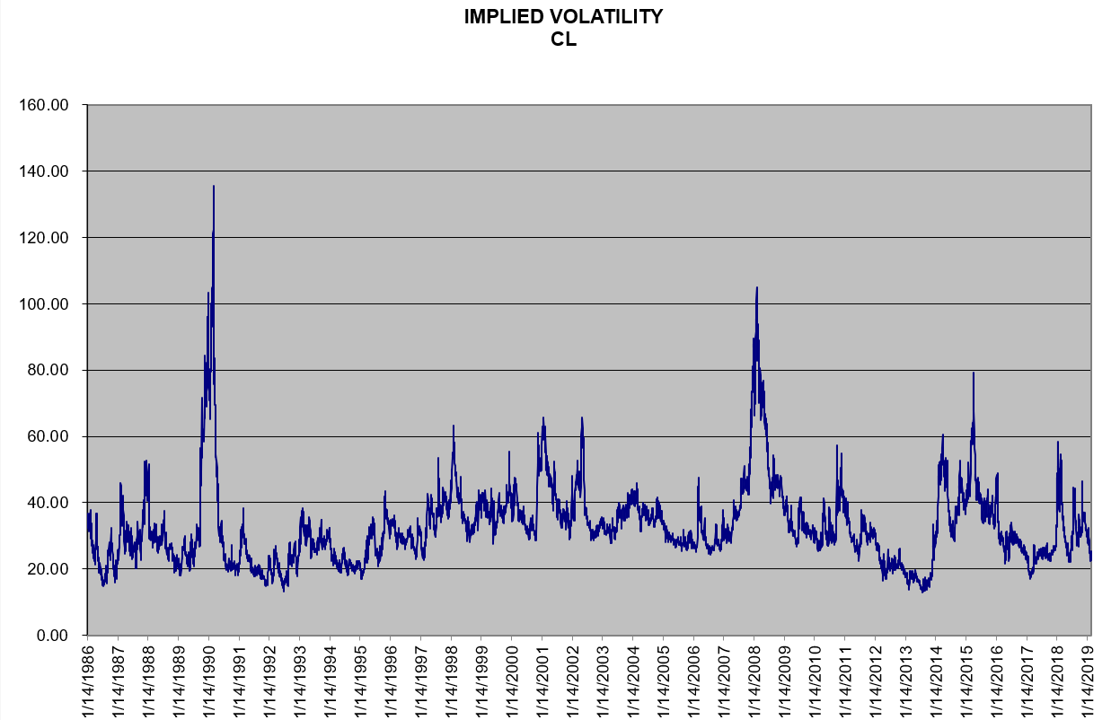
2019 WTI options summary…
Average daily volume in WTI options was almost 30% lower in 2019 vs 2018 with 124,012 trading... Implied vol averaged 31.25 with the high, 53.0,
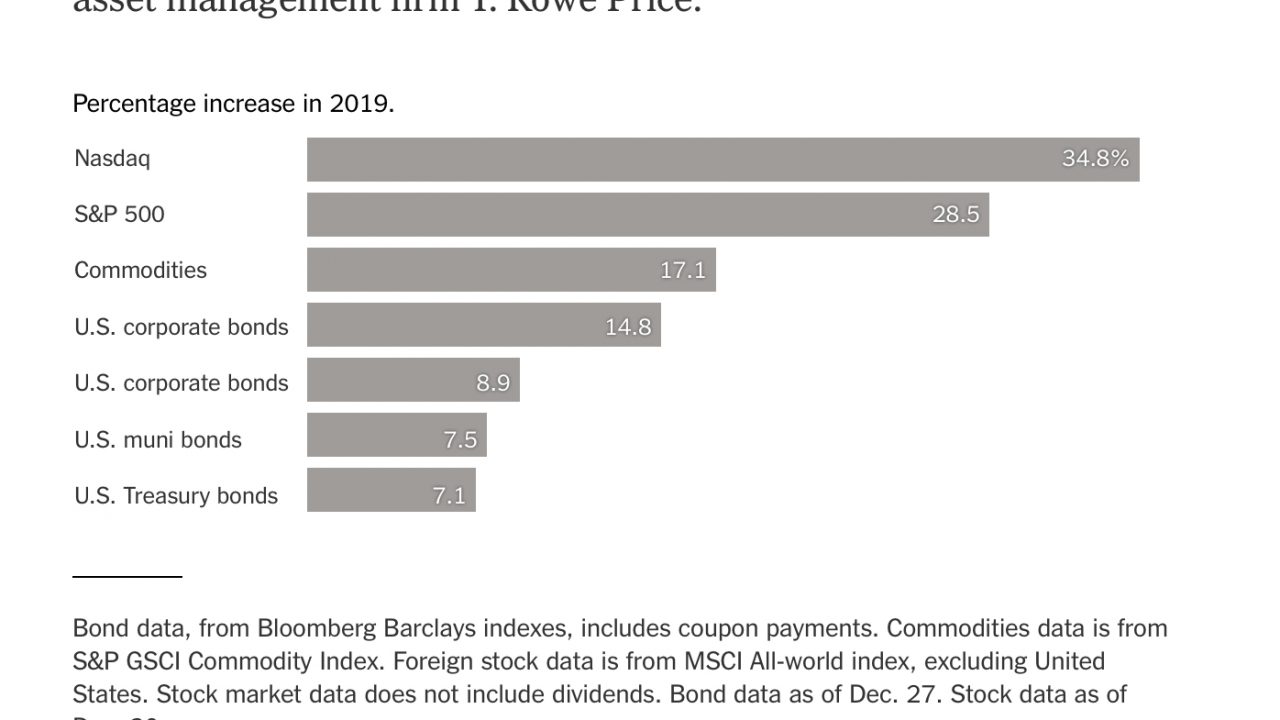
Markets in 2019… NY Times
“You couldn’t lose money if you tried”... This from Matt Phillips, The NY Times, reporting on returns of various asset classes in 2019... Here is the