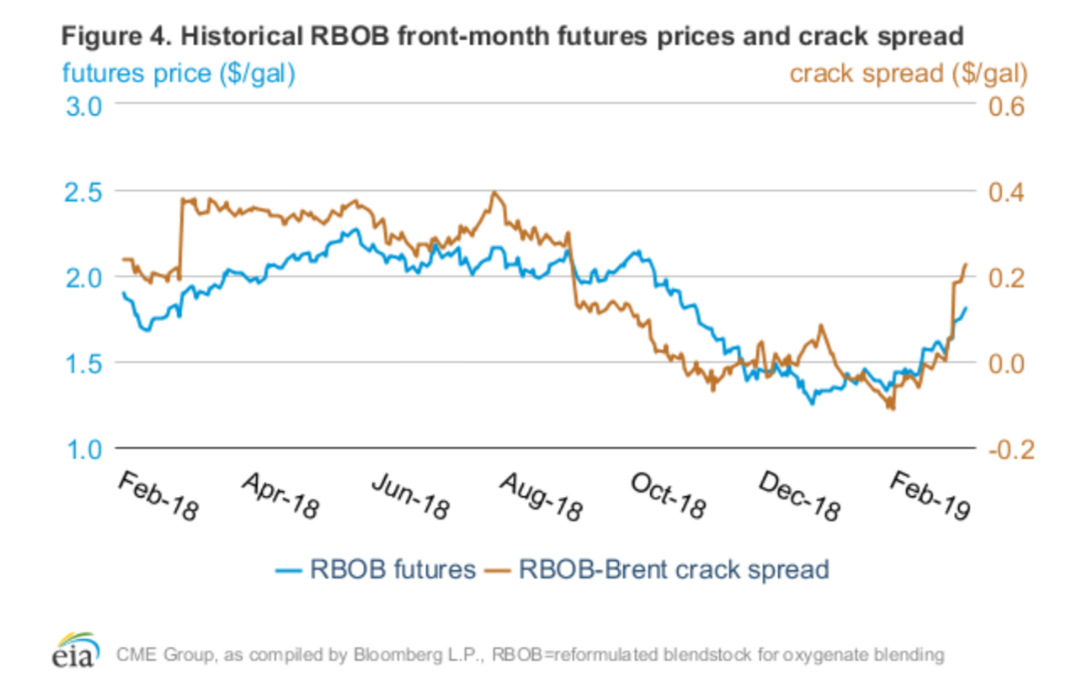
More from today’s release of the EIA’s Short Term Energy Outlook, here... ”Despite the increase in the RBOB–Brent crack spread in recent weeks, it
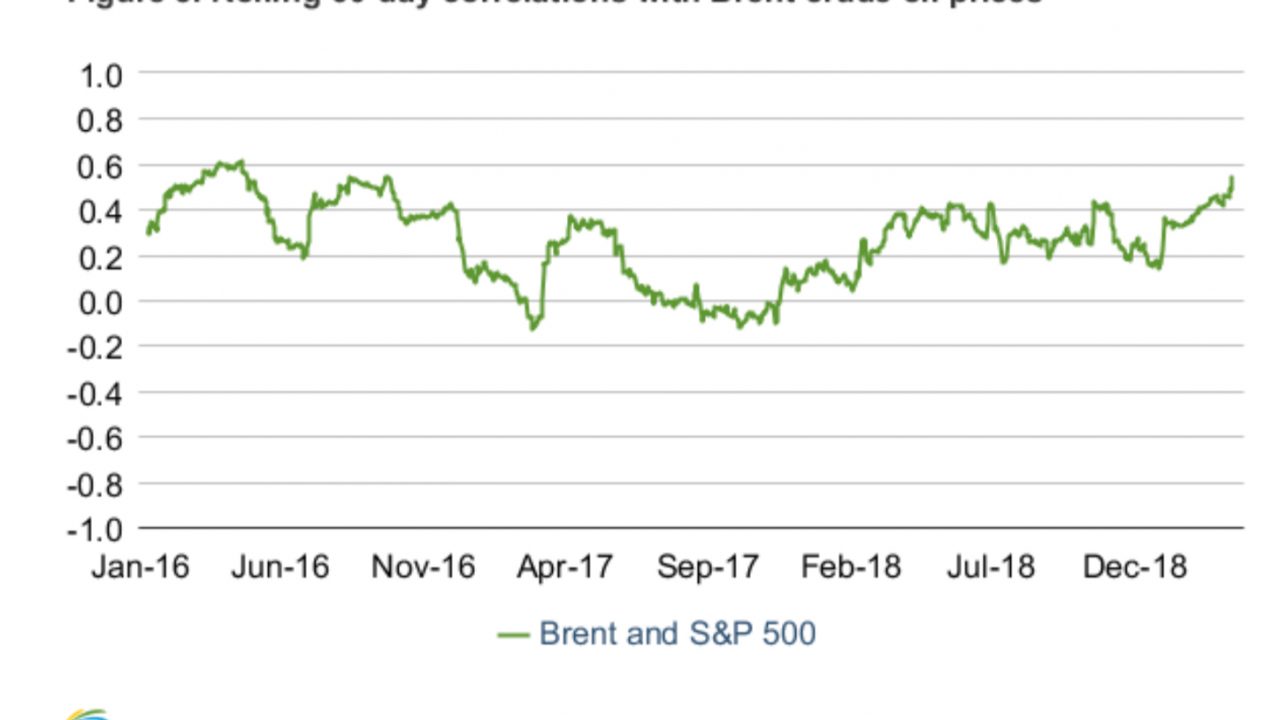
Brent vs S&P, correlation… EIA
The EIA’s Short Term Energy Outlook is out, here... The summary includes a nice correlation chart showing Brent vs. the S&P with an
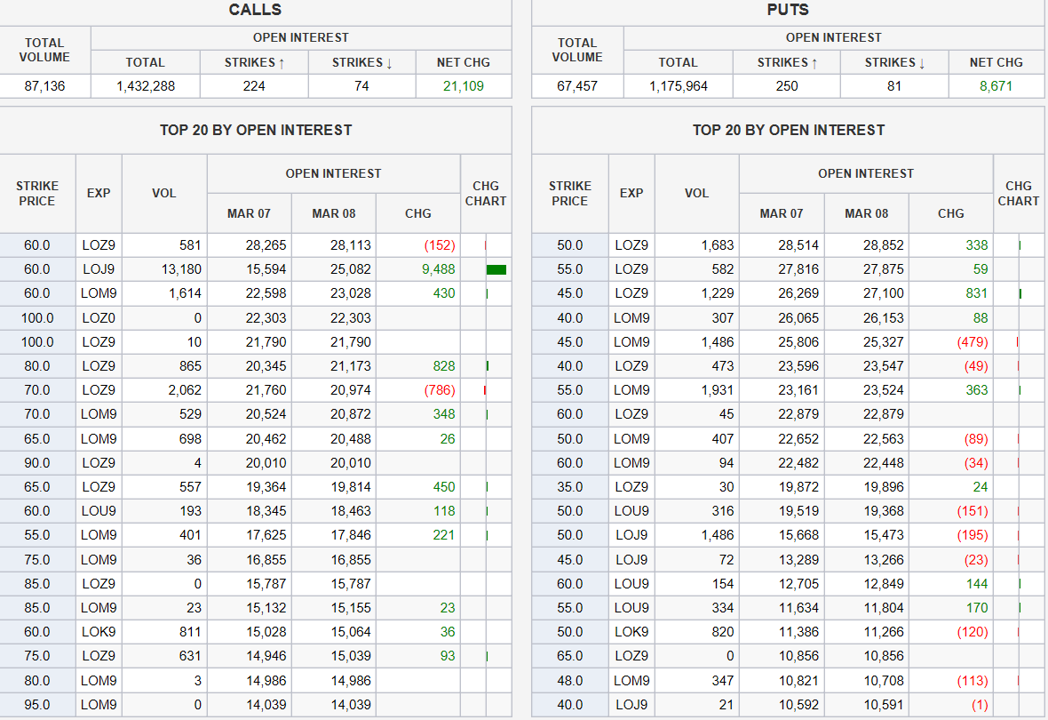
WTI options update…
Amazingly, a WTI oil option traded over 10,000 times... Volume has been extremely low since mid-December... Here is a snap shot from the CME's "Most
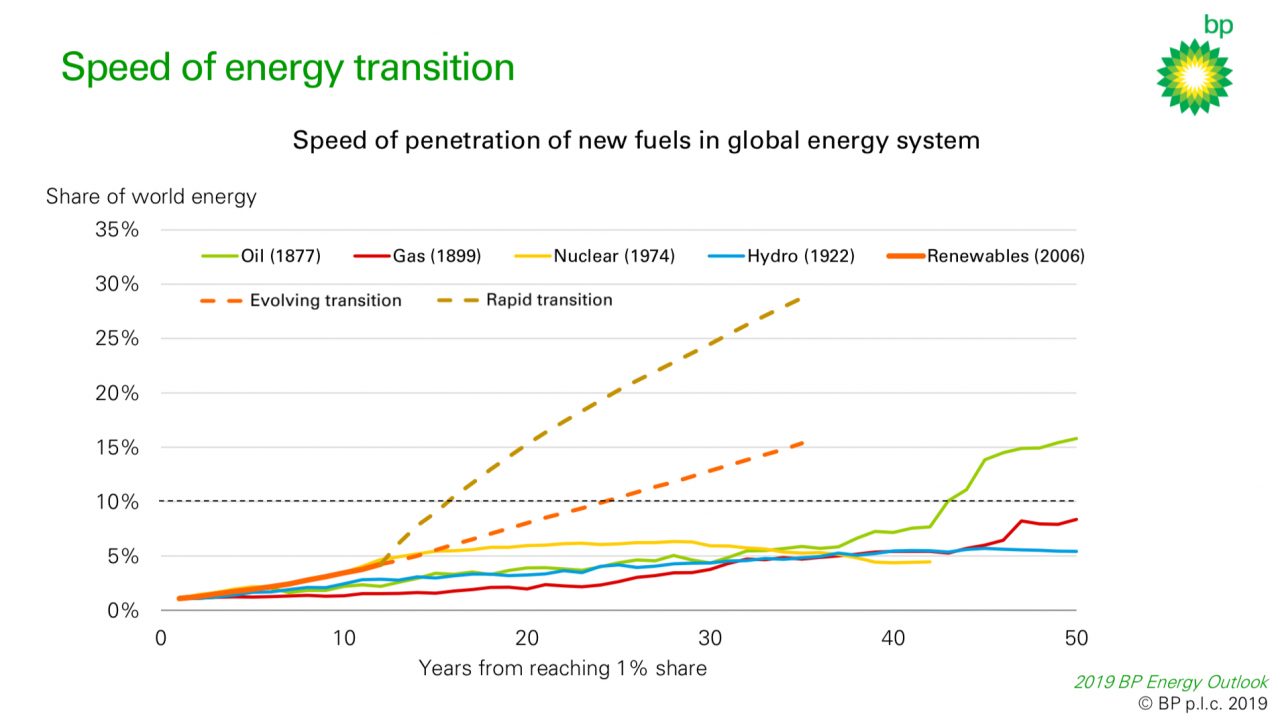
BP Energy Outlook… Spencer Dale
Spencer Dale, BP’s chief economist, did a great job presenting BP’s energy outlook at an event put on by Columbia University’s SIPA Center on Global

CTA funds under management… BarclayHedge
I use data from barclayhedge.com for this chart showing CTA funds under management:
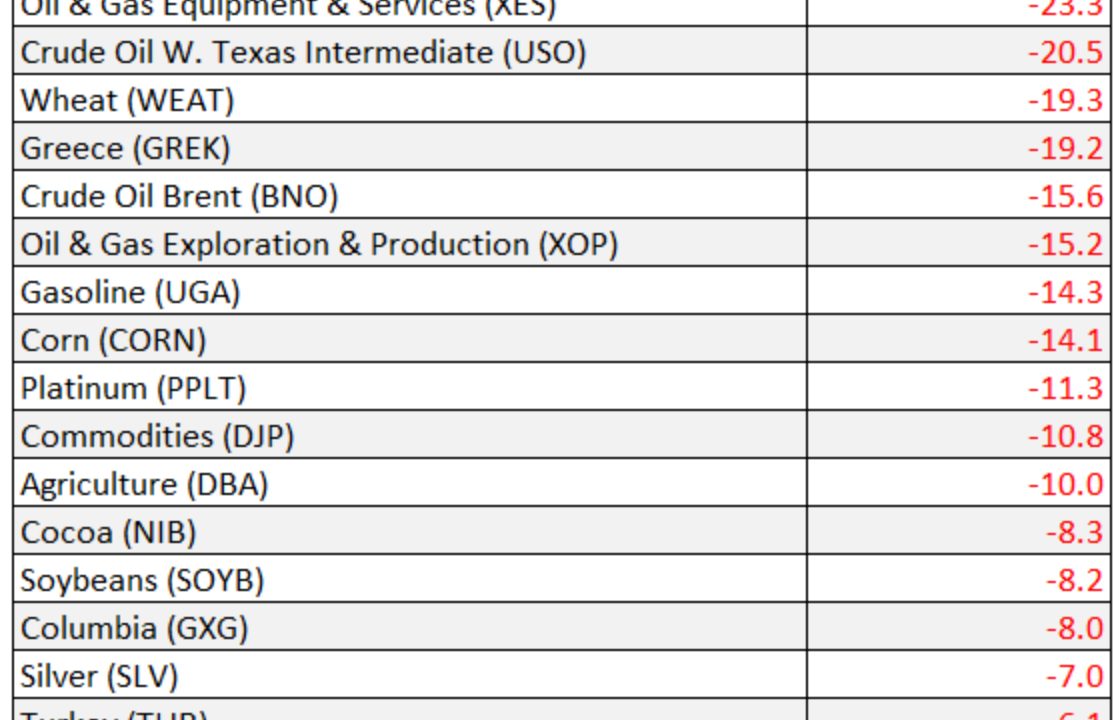
Commodities still dominate… The Capital Spectator
Of course, The Capital Spectator, here, is looking at asset classes from a “battered and bruised assets” perspective (and a long only
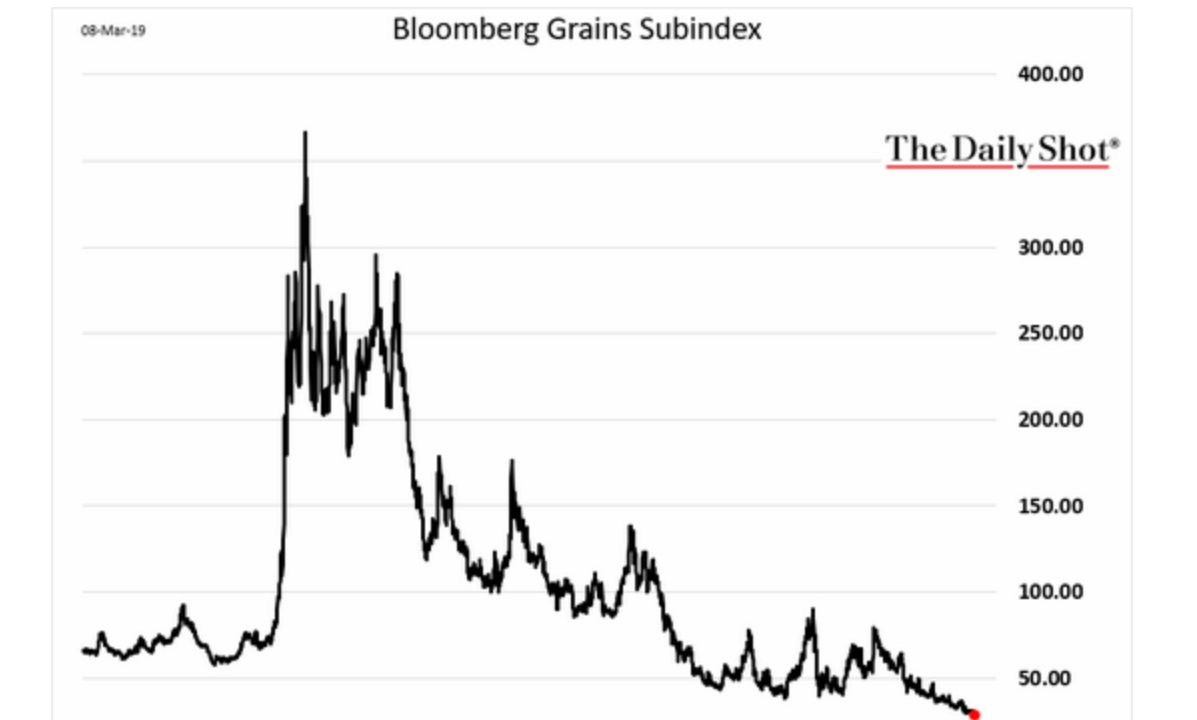
Bloomberg’s US grains index, record low…
My first official job out of college was as a grains analyst for the USDA... I don’t follow grain markets closely anymore but I was interested to see
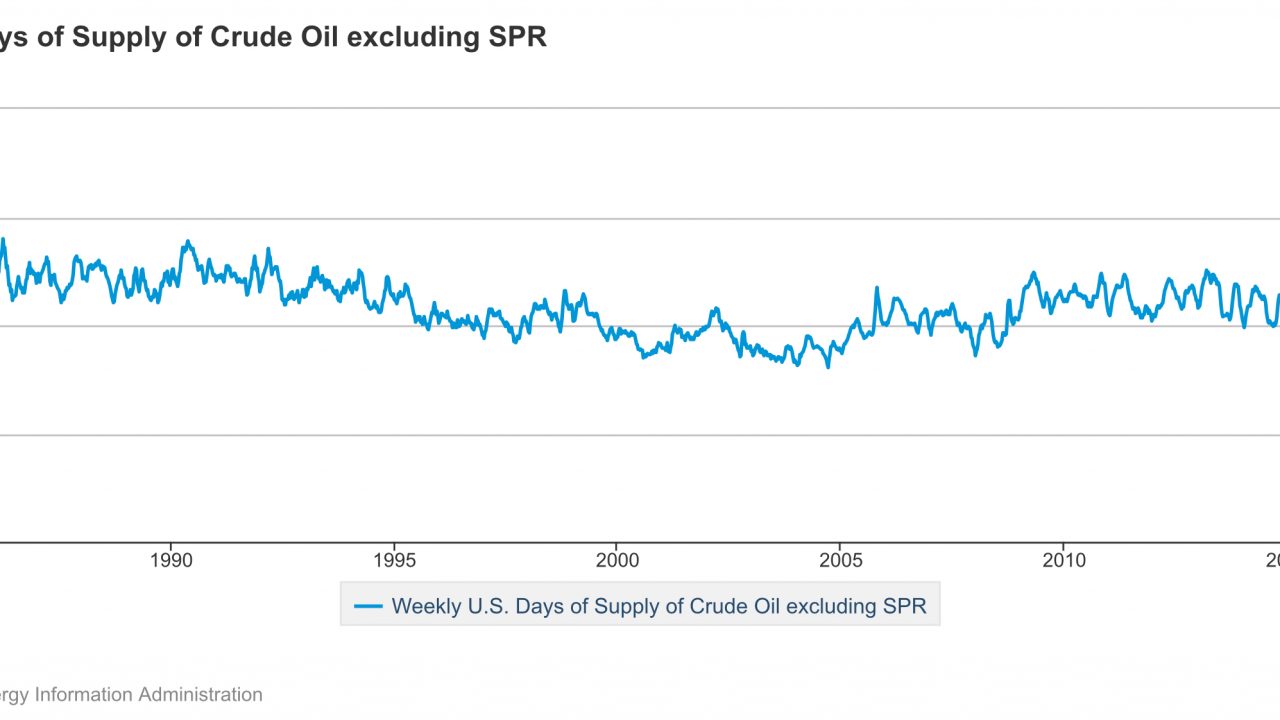
US Days Supply of Crude Oil… EIA
Days supply compares stock levels with daily demand... Here is the EIA’s chart:

Record US electricity generation in 2018… EIA
Another good piece from the EIA’s Today in Energy, here: “Population-weighted cooling degree days, an indicator of warm weather and air