The EIA’s Short Term Energy Outlook is out, here… The summary includes a nice correlation chart showing Brent vs. the S&P with an explanation…
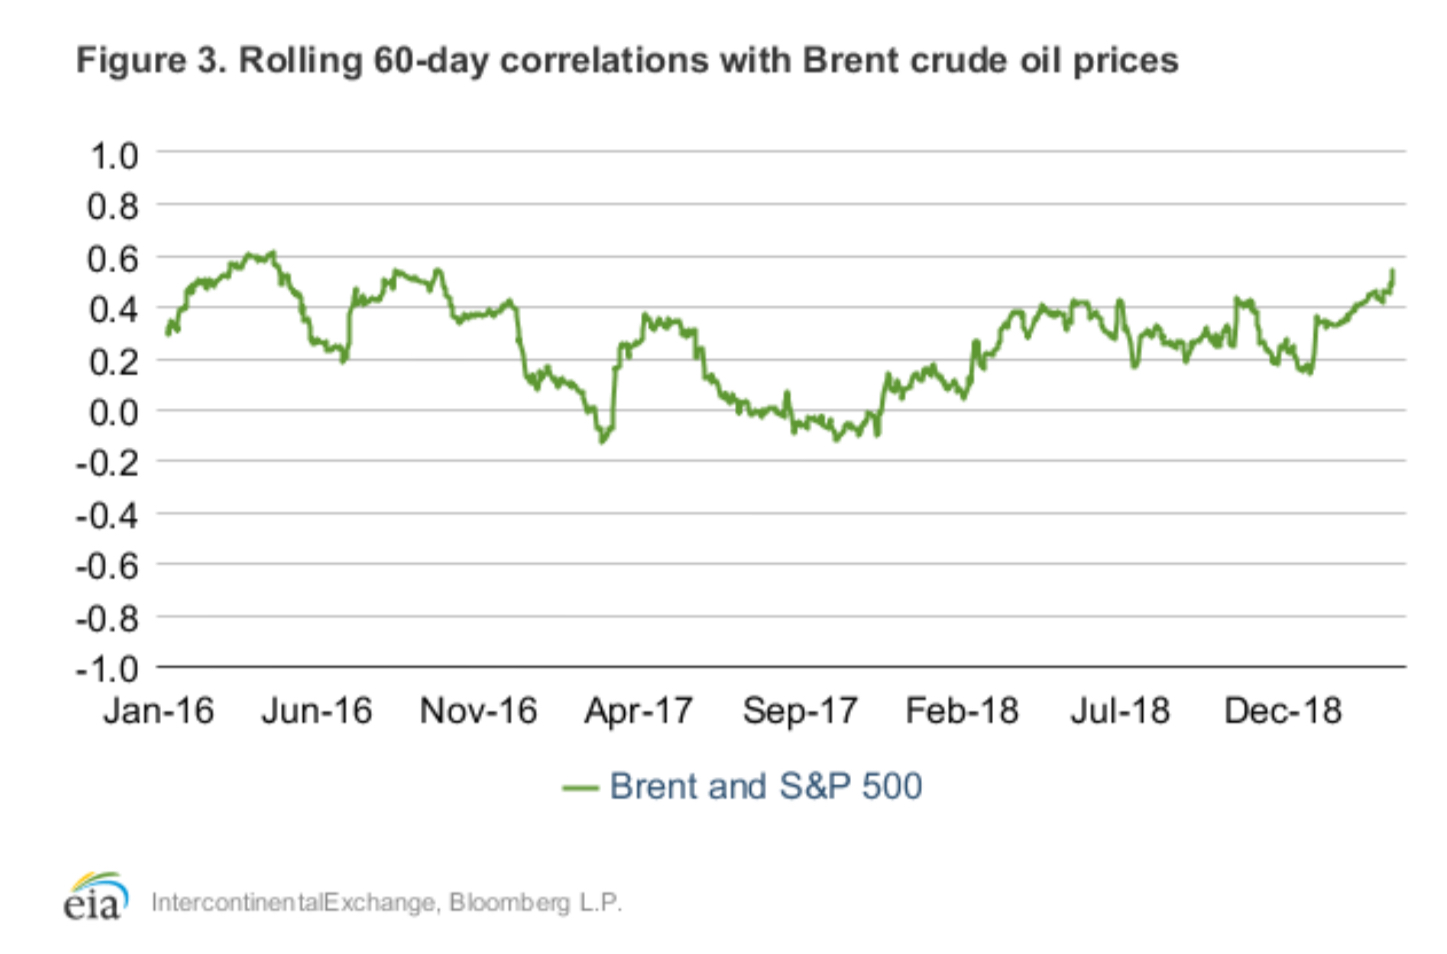
“Correlations: Typically, a strong positive correlation between equity prices and crude oil prices indicates demand-side factors, such as global economic growth, are contributing to crude oil price formation. Front-month Brent crude oil’s rolling 60-day correlation between the daily percentage changes of the S&P 500 index reached the highest levels since 2016 in early March (Figure 3). Correlations increased as prices for both equities and crude oil declined in the fourth quarter of 2018 with the release of some economic data points that came in lower than market expectations and tightening global monetary policy. However, recently, the improvement in some economic data may have contributed to upward price pressure for both equities and crude oil. The delay of tariffs between the United States and China, as well as the potential for a trade agreement between the two countries, could contribute to increased economic activity. Furthermore, recent global central bank guidance has indicated looser monetary policy in 2019 compared with guidance from the fourth-quarter 2018, which could allow for easier financial conditions.”
Leave a Reply