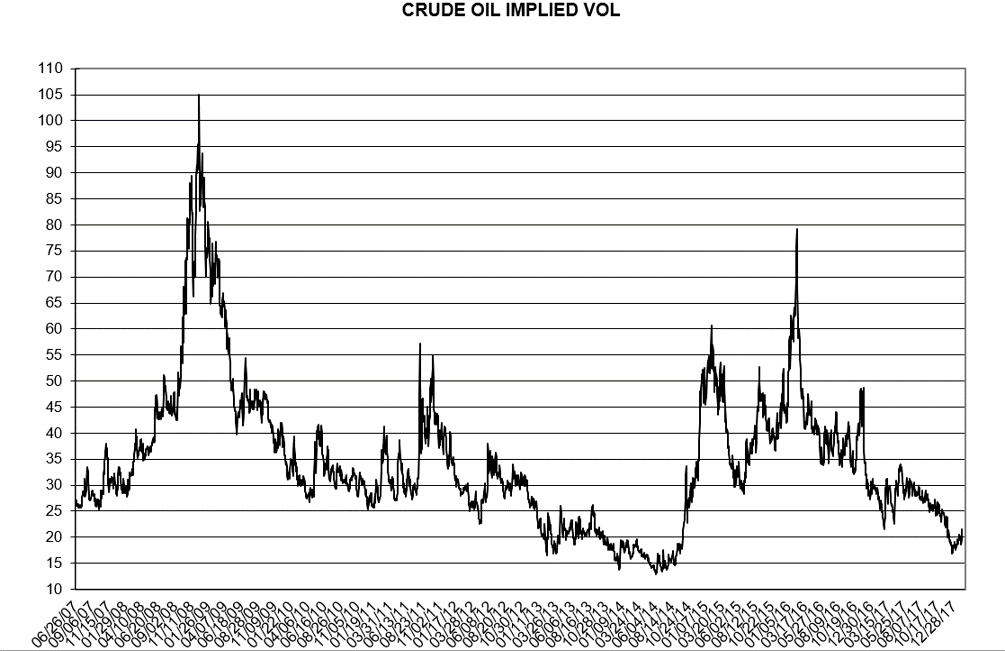
Here is an implied volatility chart based on at the money strikes, using the second nearby option (the current data is based off of options on April
Crude Oil/Dollar Correlation…Market Realist
Gordon Kristopher at Market Realist includes an interesting chart on the dollar vs. the price of crude oil: Eyeballing this chart suggests that
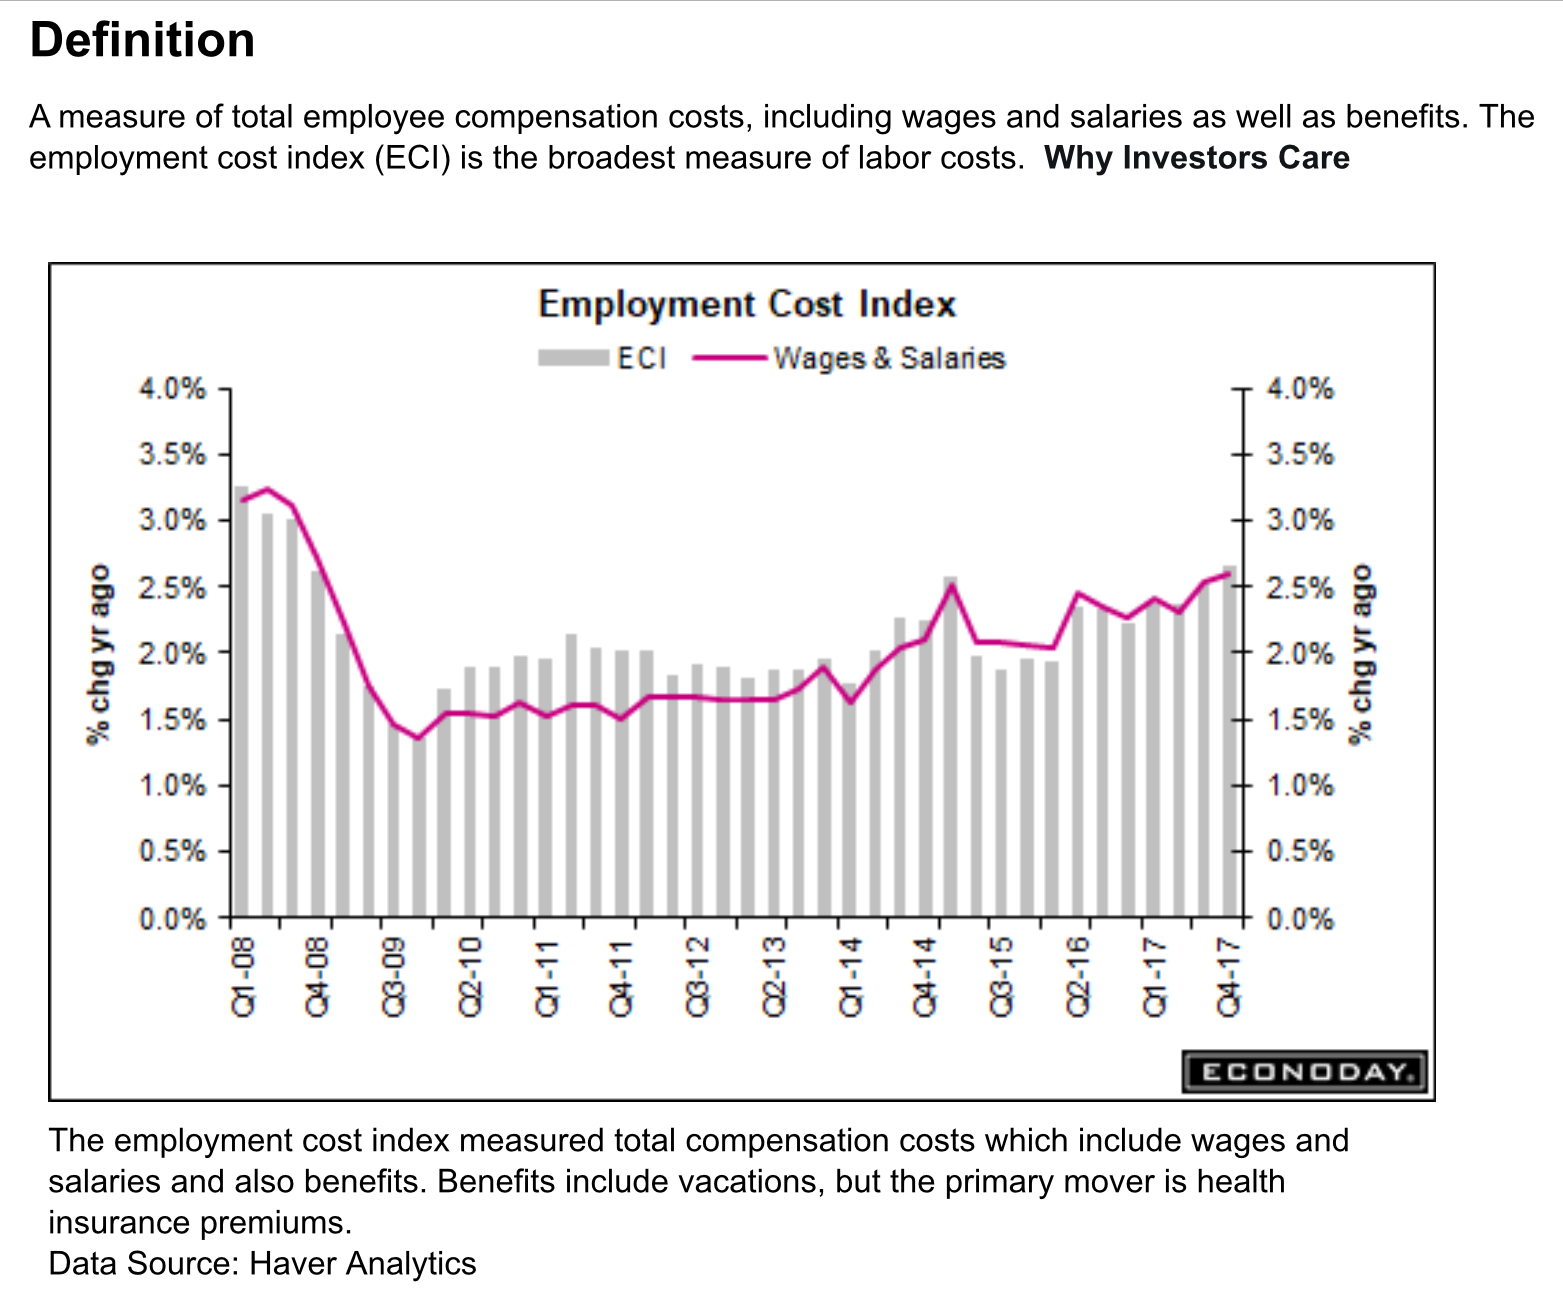
Wages, interest rates on the rise… WSJ, FRED
Two data points released this week suggest that wages and compensation are on the rise... Here, from the Wall Street Journal, is the employment cost
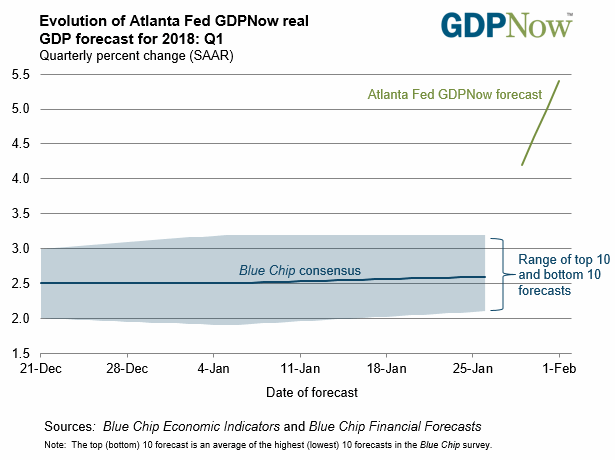
Dueling Fed GDP Nowcasts…
The Atlanta Fed raised some eyebrows with its updated “nowcast” of +5.4% for 1Q2018: However the New York Fed updated its “nowcast” today, to
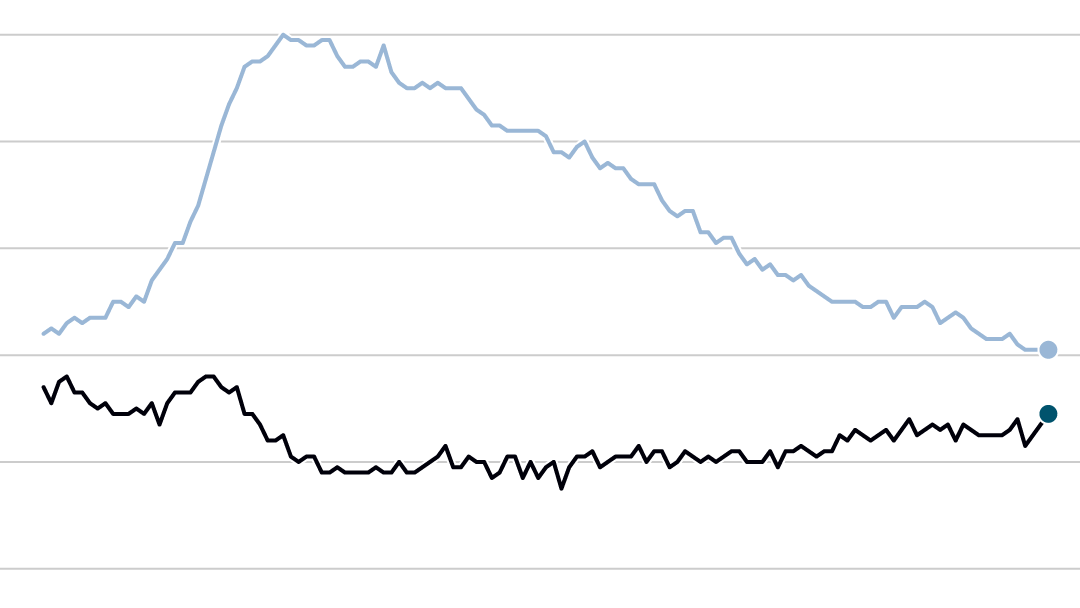
6 reasons pay has lagged job growth… NYTimes
These charts are before today’s jobs report, but wage growth has lagged... Here is today’s NYTimes (an underrated business section, by the
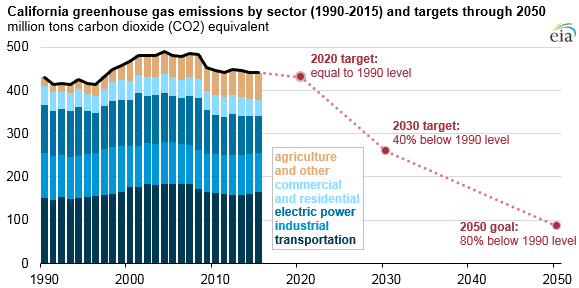
California’s emission plans.. EIA
From Today in Energy, here is a look at California’s plans to reduce greenhouse gas emissions:
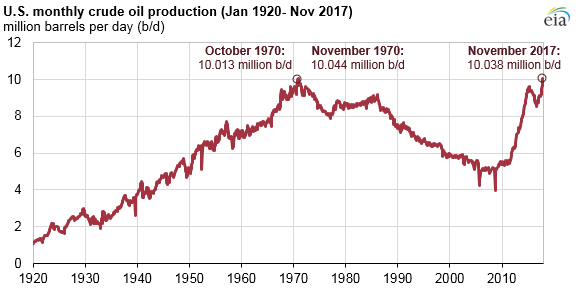
November’s US oil production exceeds 10 million barrels per day… EIA
This is the highest since November 1970: Here are more interesting charts from The EIA’s Today in Energy:
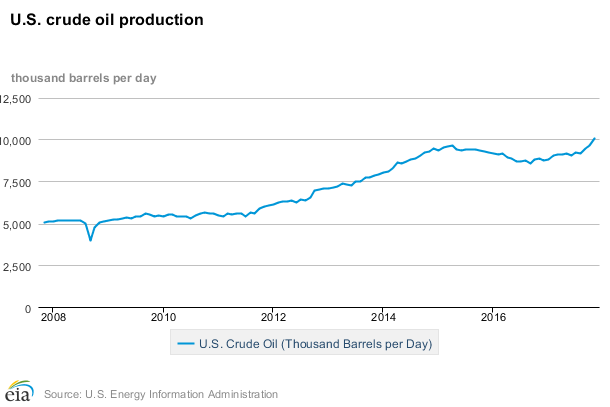
US oil production is over 10 mbd… EIA
The EIA’s Monthly Crude Oil Report shows US oil production at just over 10 million barrels per day for November: ‘Here is the Wall Street
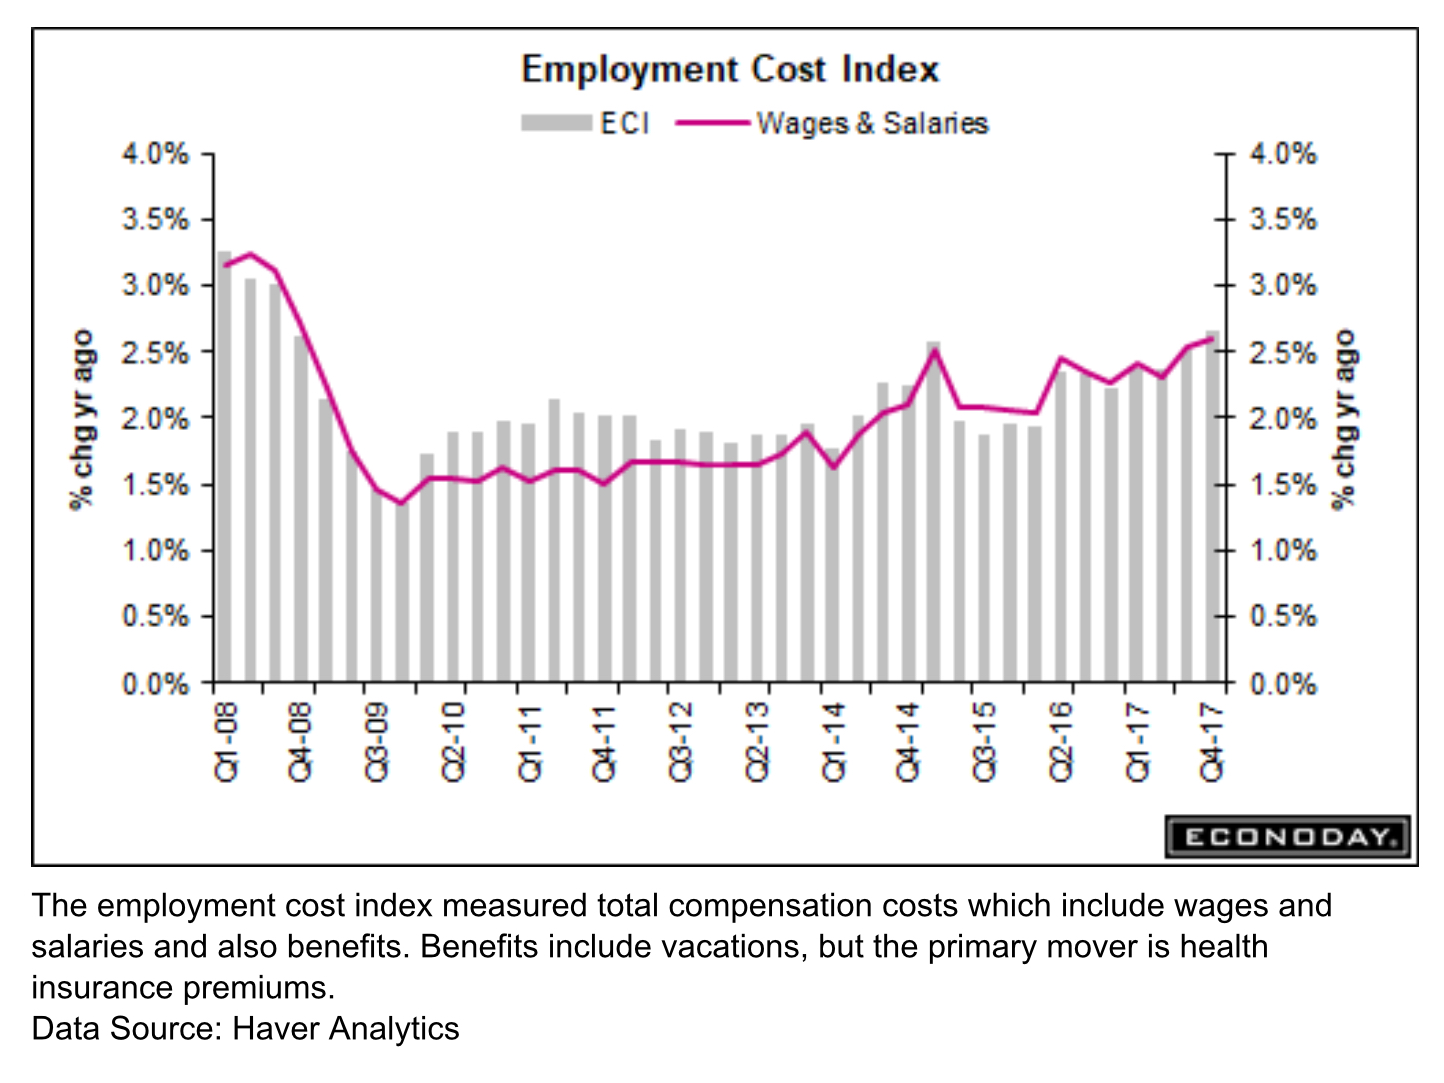
Employment Cost Index on the rise… WSJ
The Employment Cost Index was released this morning and was up 0.6 for the quarter and up 2.6 y/y: Here is the