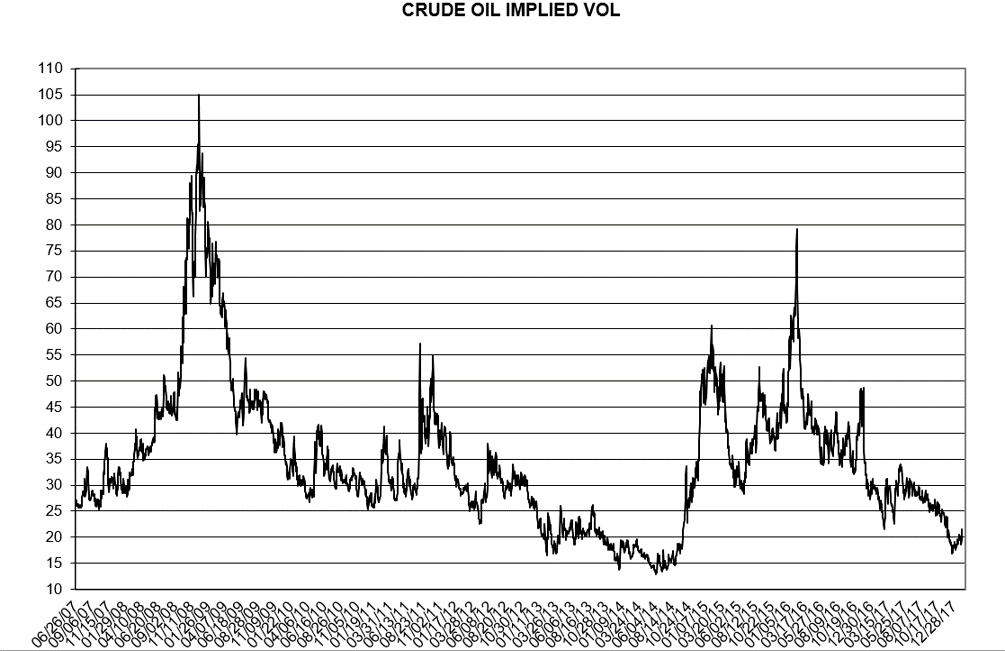
Here is an implied volatility chart based on at the money strikes, using the second nearby option (the current data is based off of options on April futures), and includes yesterday’s settlement vol:
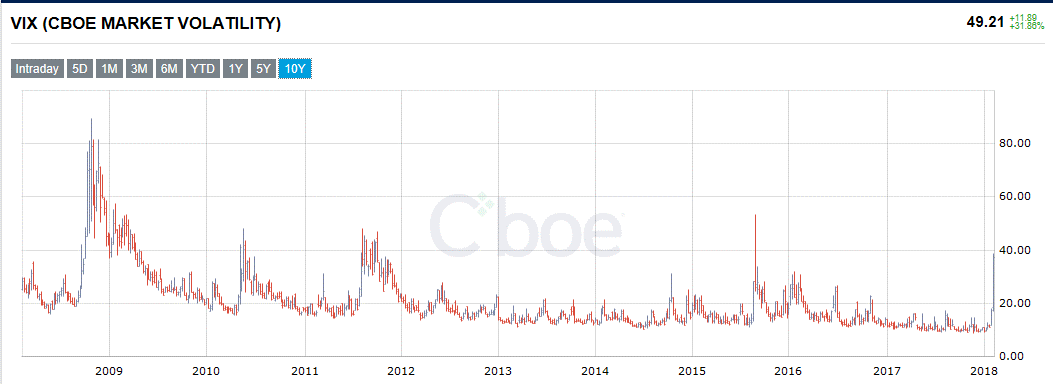
The recent increase is small relative to the stock market VIX, which I pulled off the CBOE’s site this morning:
Here is the oil VIX, also from the CBOE:

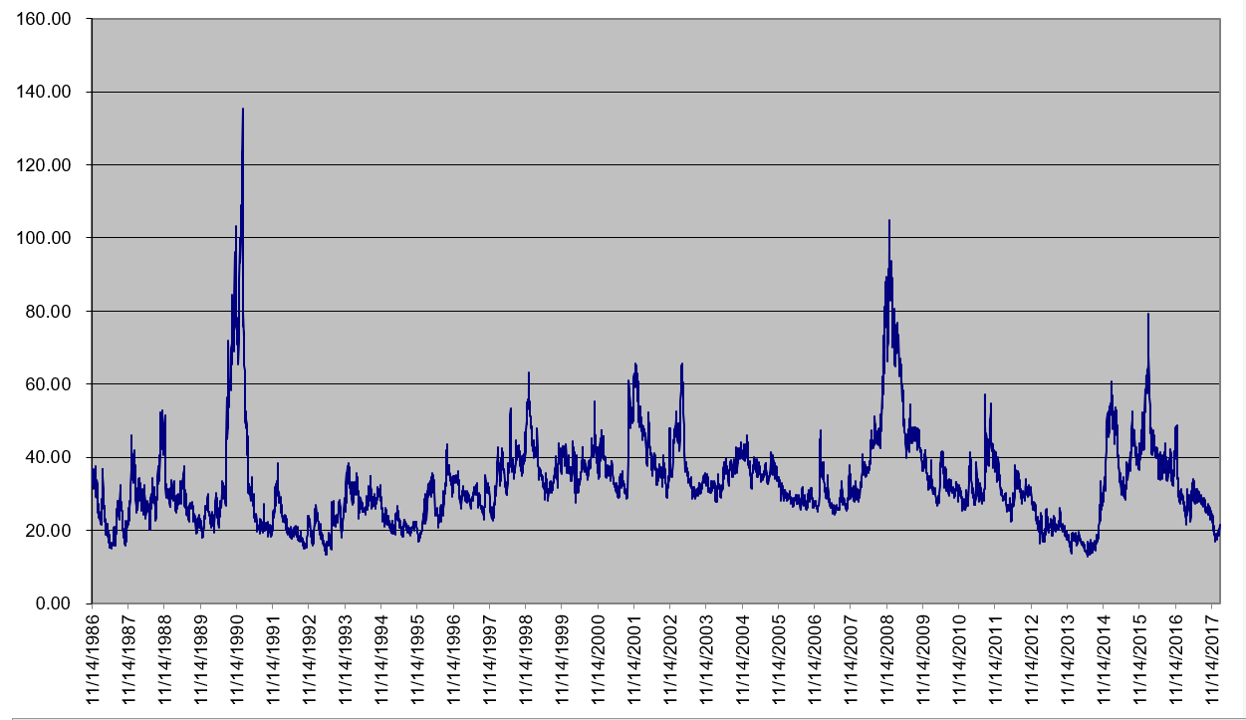
And here is a chart I have been updating since November 14th, 1986 which shows implied volatility for crude… Test question: what were the fundamental drivers for the three main peaks?
Leave a Reply