
The EIA’s excellent series This Week In Petroleum always has something interesting for oil traders... The charts below show stock levels of gasoline,

A look at US petroleum exports, 1H2018… EIA
In “This Week In Petroleum”, the EIA discusses US petroleum exports for the first half of the year and provides many informative charts: “The
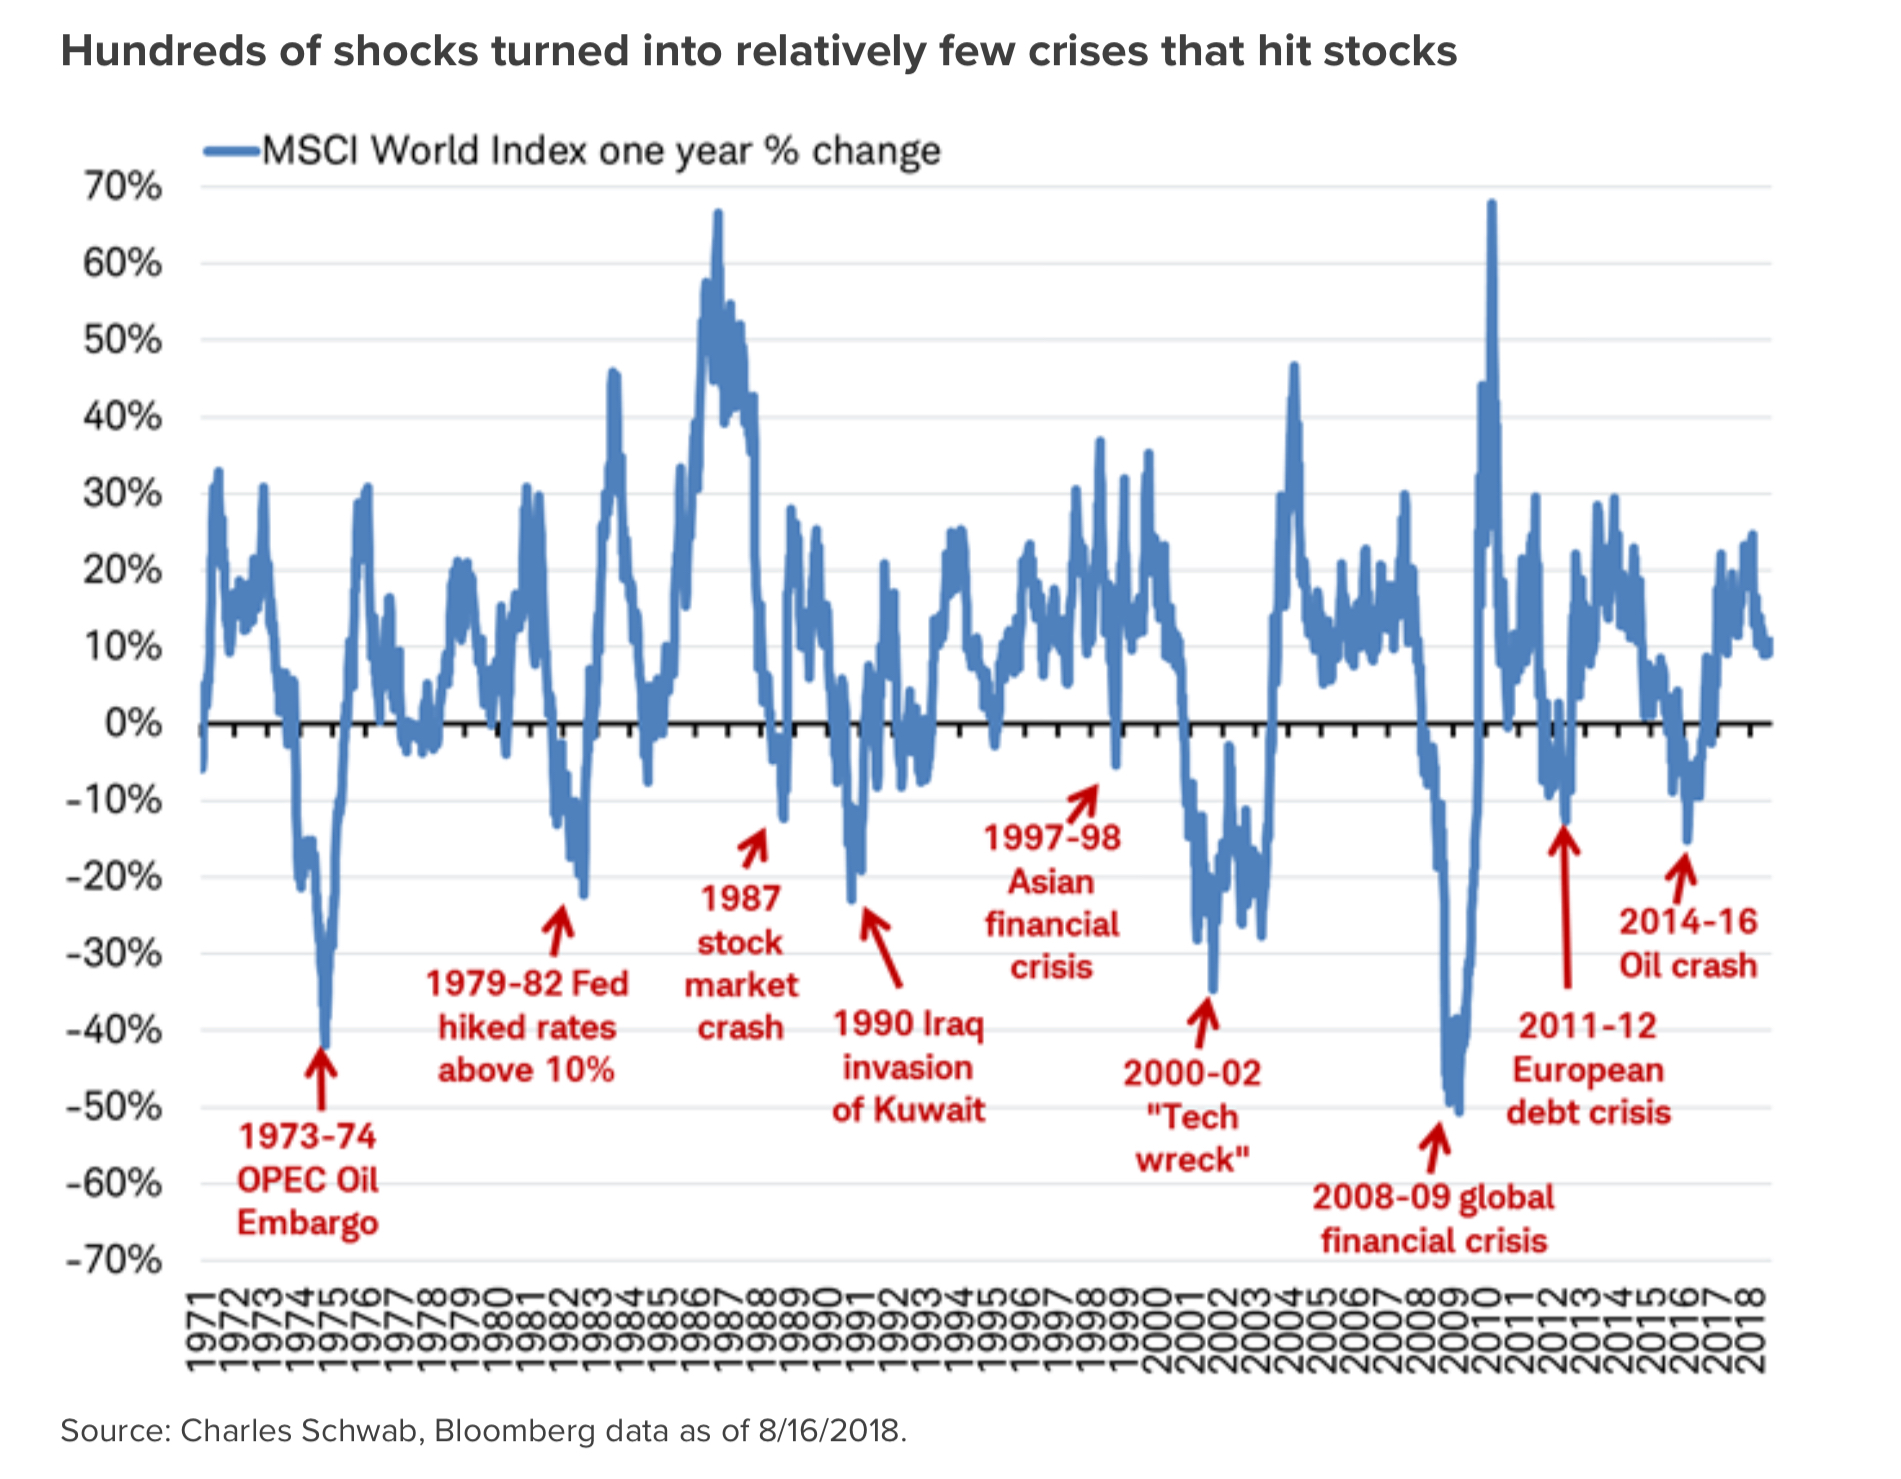
The next crisis?… Charles Schwab
Jeffrey Kleintop, Charles Schwab, has a nice piece called “Where Will the Next Crisis Come From?”... Here are some takeaway charts: Hat

US CO2 emissions fell in 2017… EIA
Only slightly, but here is the EIA’s “Today in Energy”: And note the economy is less carbon intensive:
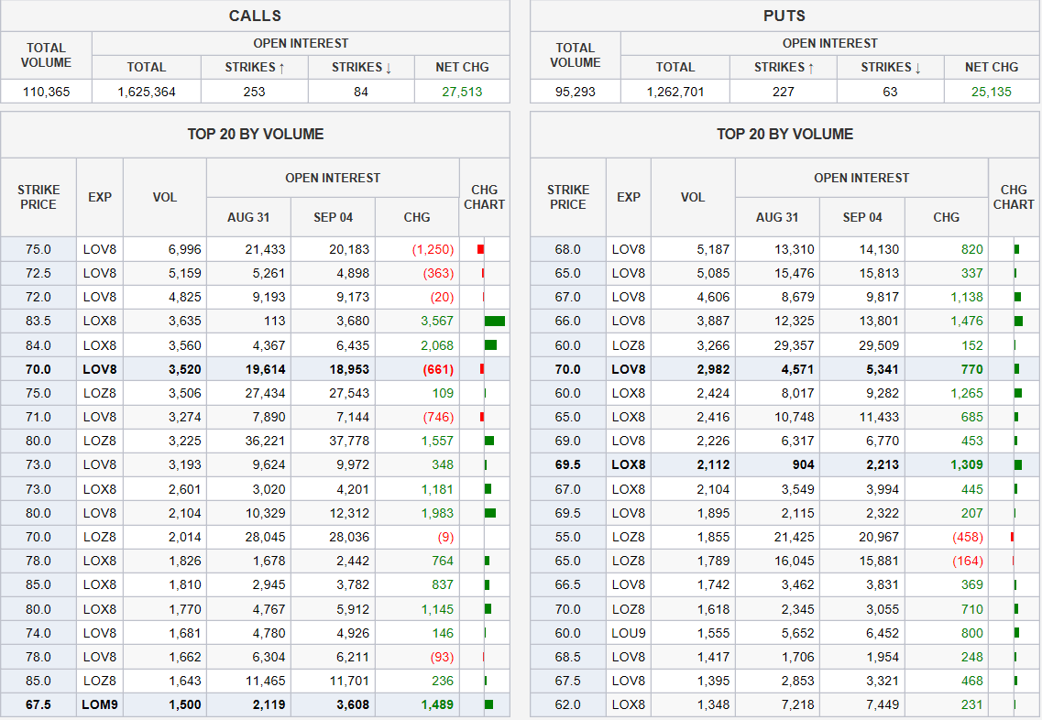
Yesterday’s (Monday) option activity…
Yesterday was a good volume day for WTI options with over 200,000 trading... This compares with an August average daily number of 127,669, down 11.7%
America’s energy boom on shaky footing… Bethany McLean, NY Times..
The piece can be found here and is interesting throughout... ”And yet only five of the top 20 fracking companies managed to generate more cash than
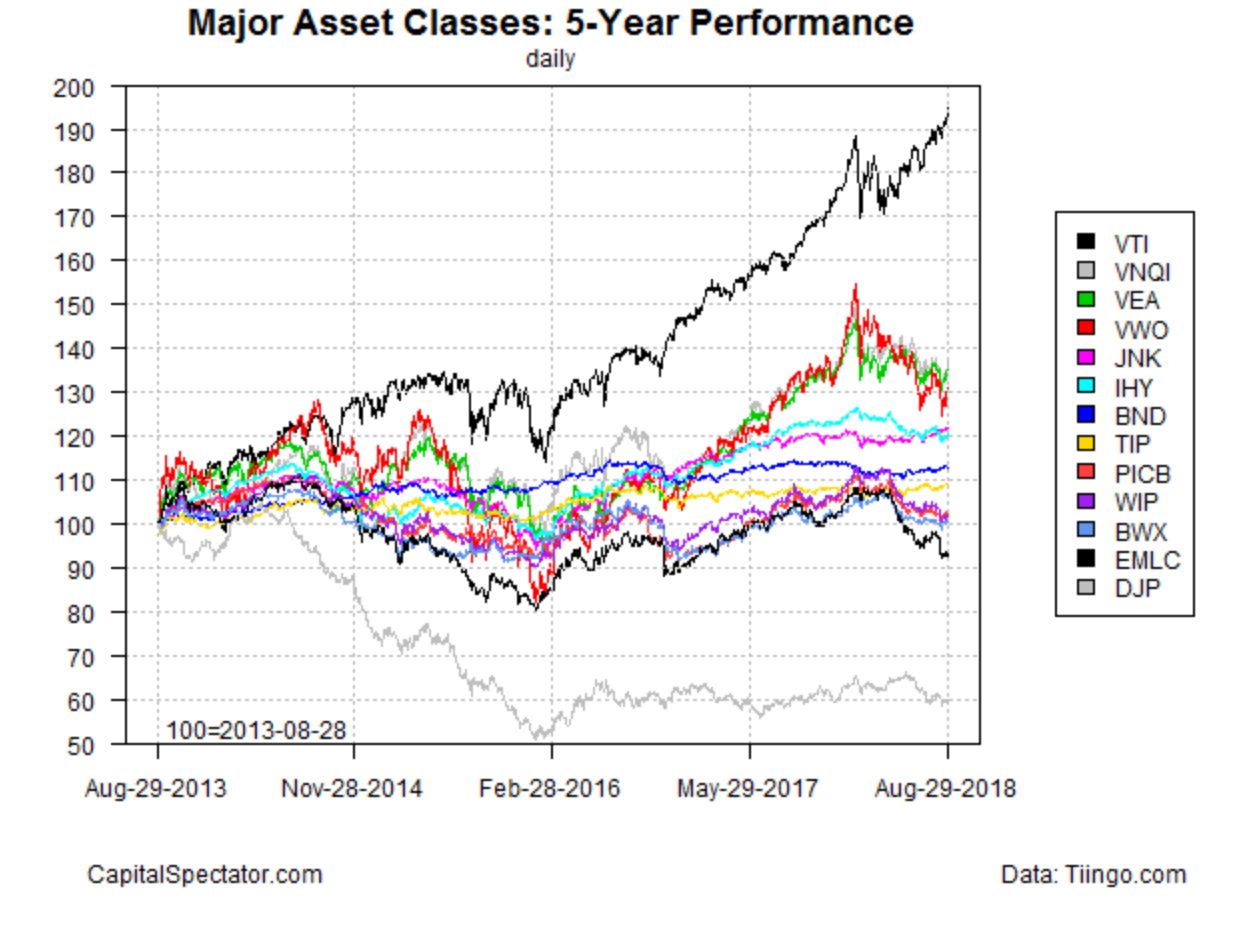
US stocks outperforming everything… The Capital Spectator via Ritholz
Barry Ritholz posts a piece by The Capital Spectator showing comparisons of returns for different asset classes, here... Here is the chart showing
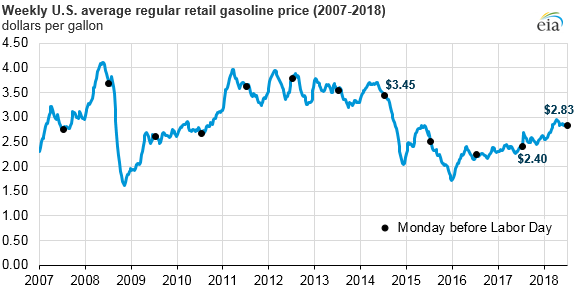
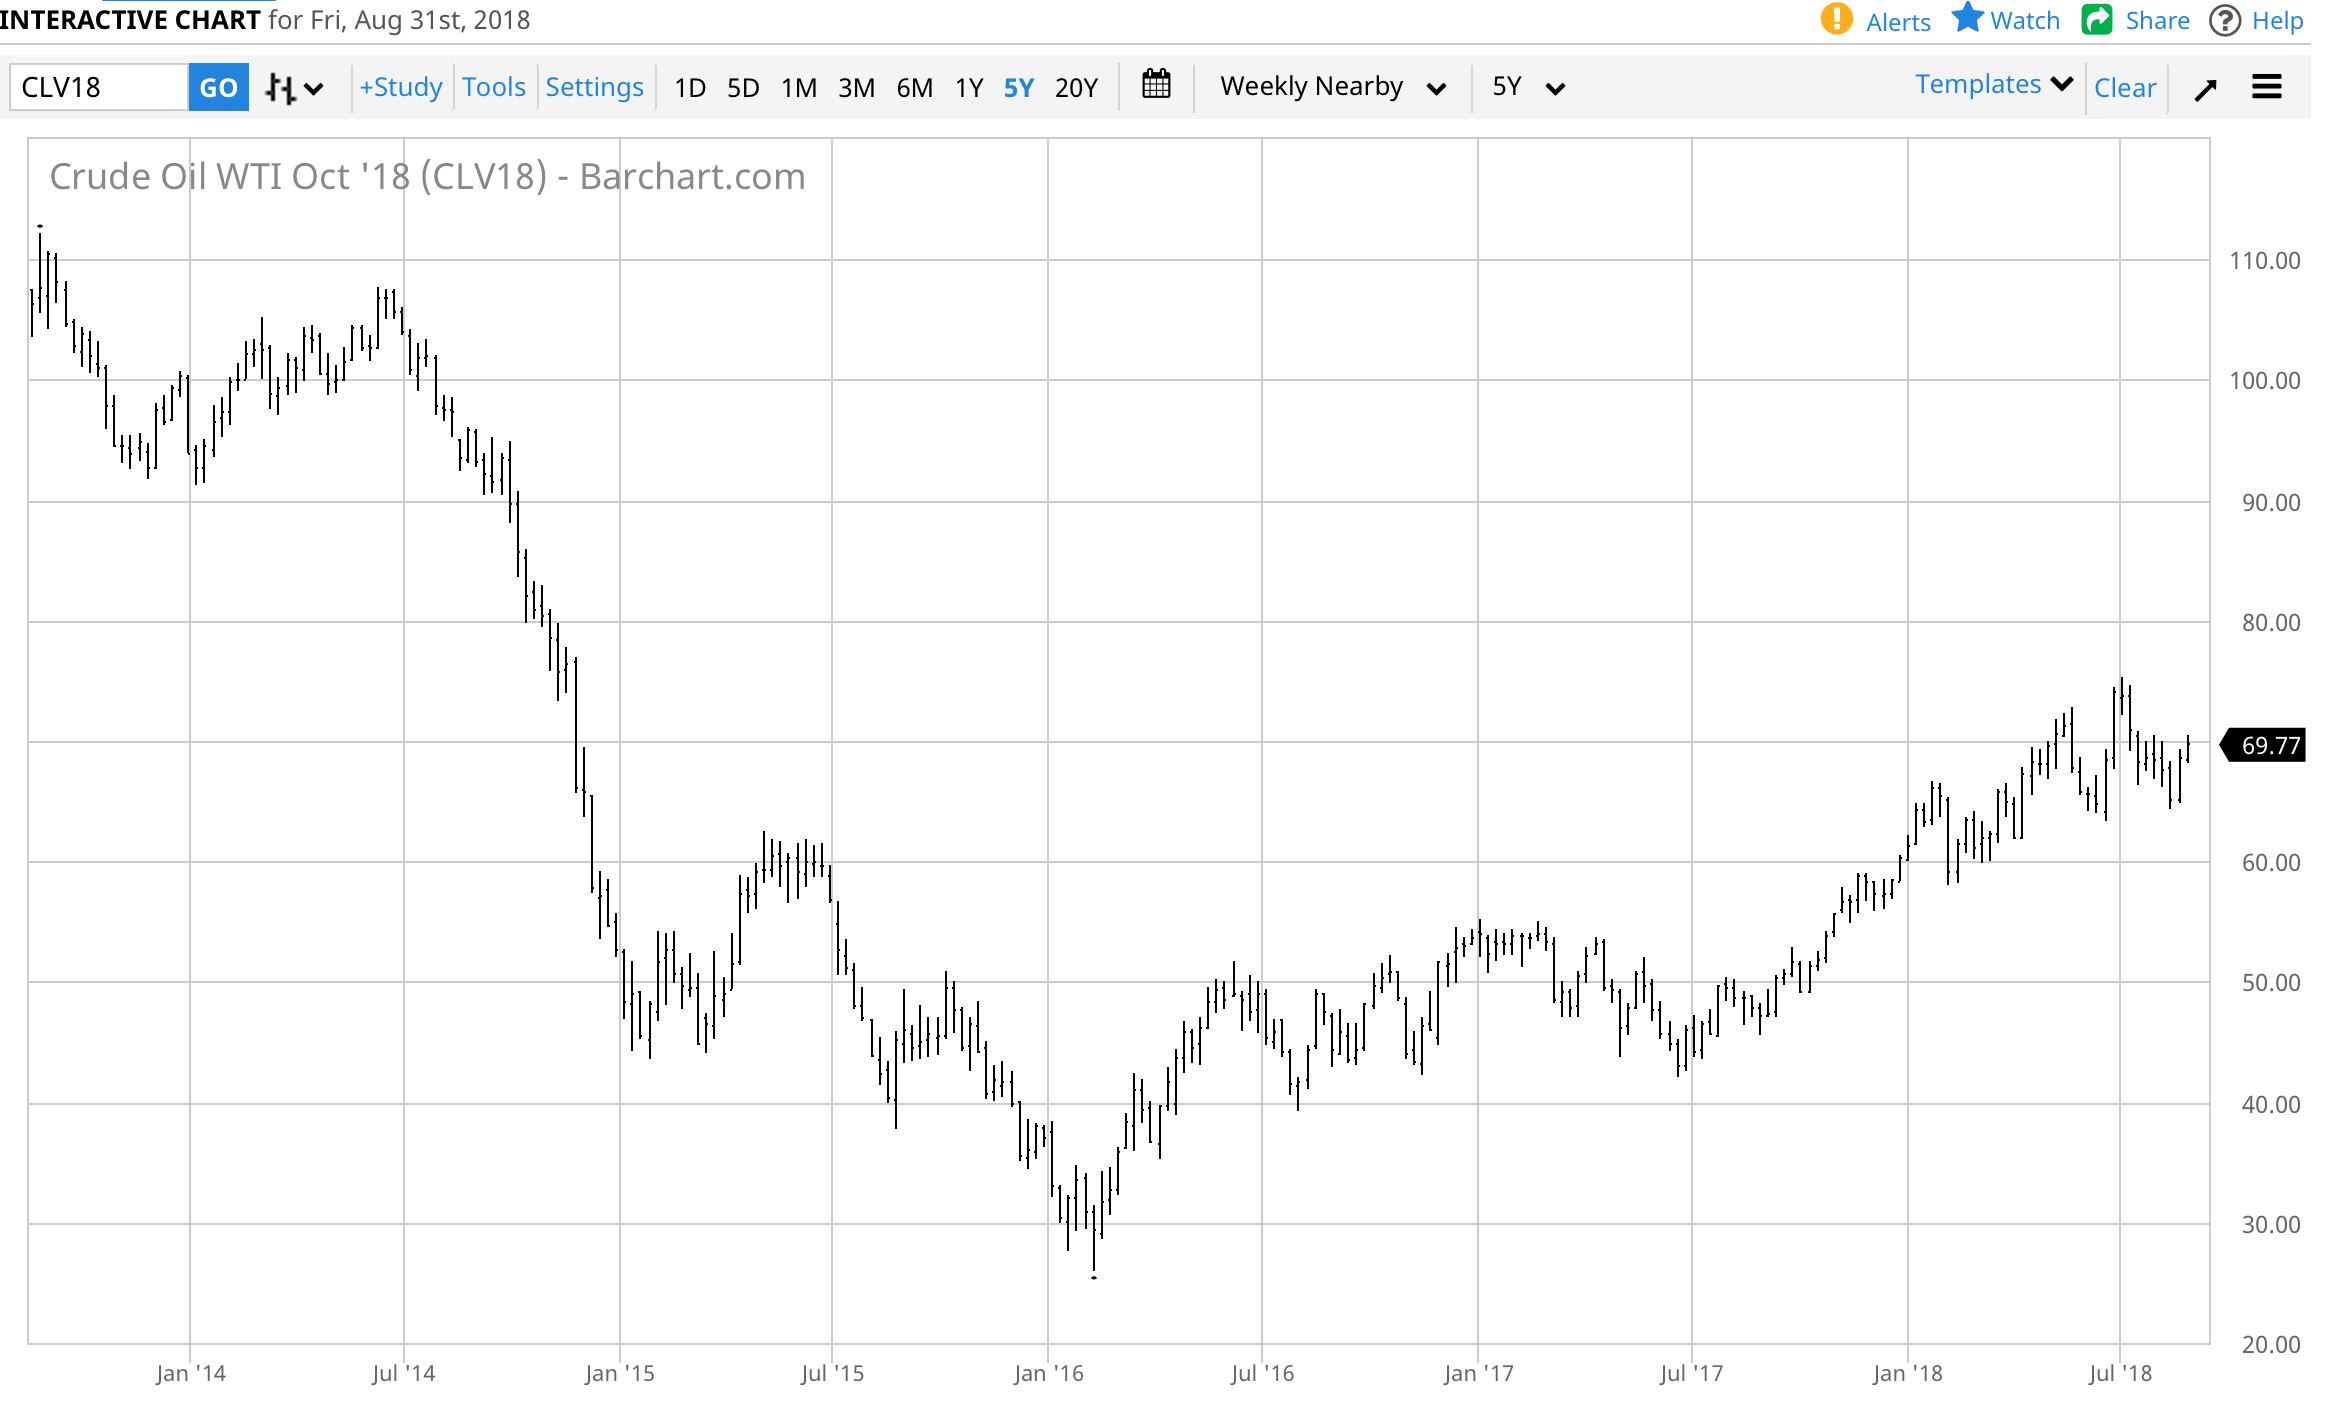
US retail prices heading into Labor Day weekend at 4 year high.. EIA
From the EIA:
Options update…
WTI traded over $70 yesterday: Here is the CME’s snapshot of options trades ranked by change of open interest: