Emerging markets have participated in the US election rally... Here is Bloomberg: ”Gains for emerging markets would support the view that the
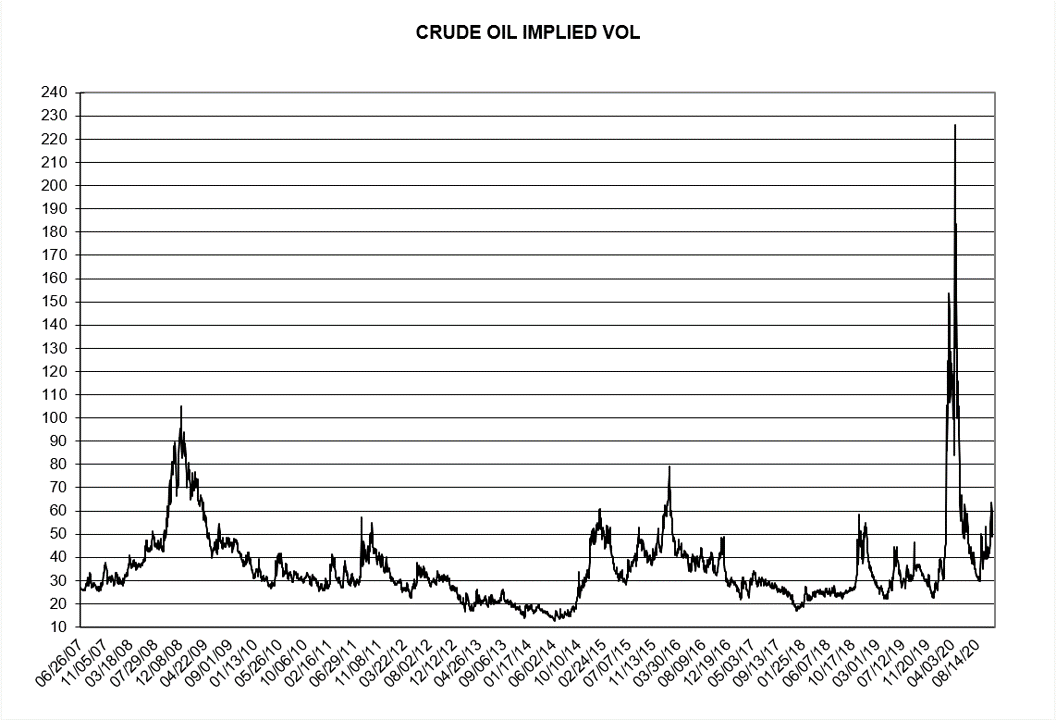
Updated WTI vol chart…
Here is an updated implied volatility chart for WTI based on at the money, second nearby options... The big spike occurred early this year after WTI
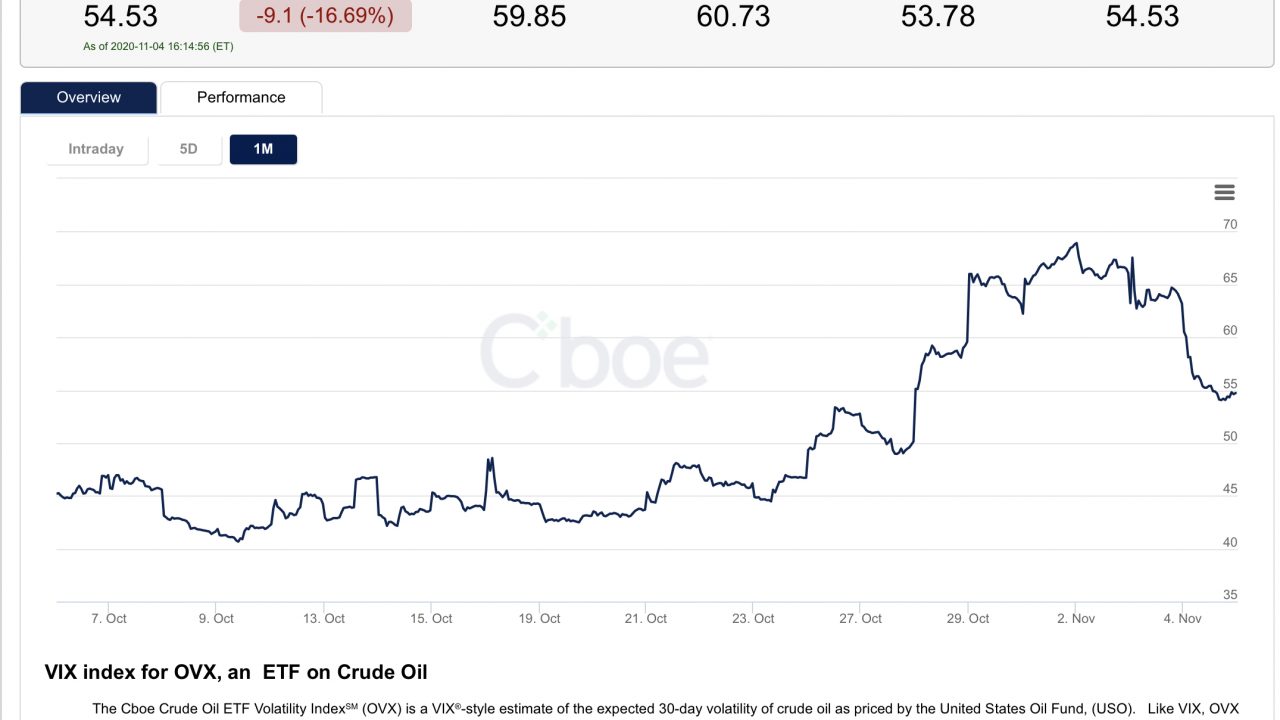
Oil vol moves lower…
Here is a chart showing the Oil VIX from the CBOE... Vol tends to decline on price rallies, and the election is behind us, sort of...
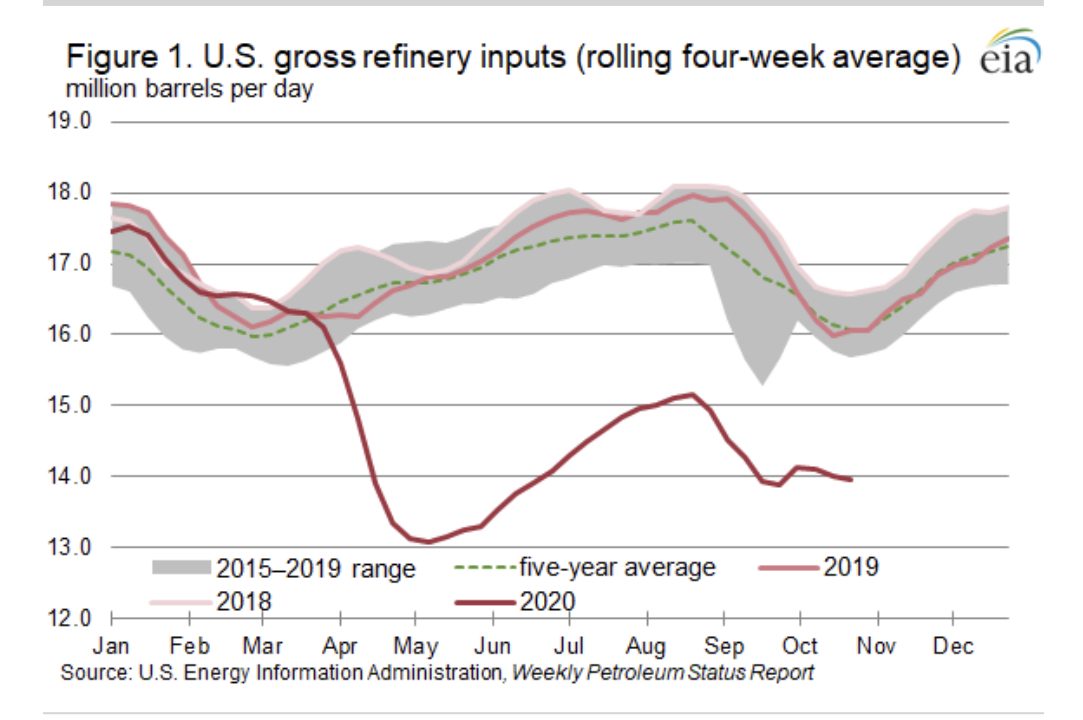
Refinery runs… EIA
Here is a look at refinery runs from the EIA’s This Week in Petroleum: ”Since mid-July, refinery inputs have remained between 13% and 17% lower
Hog herd boom, ethanol, China… Bloomberg
Why I love commodity markets... “A hog herd boom amid a push to revive supplies of the nation’s favorite meat has driven up corn prices as demand
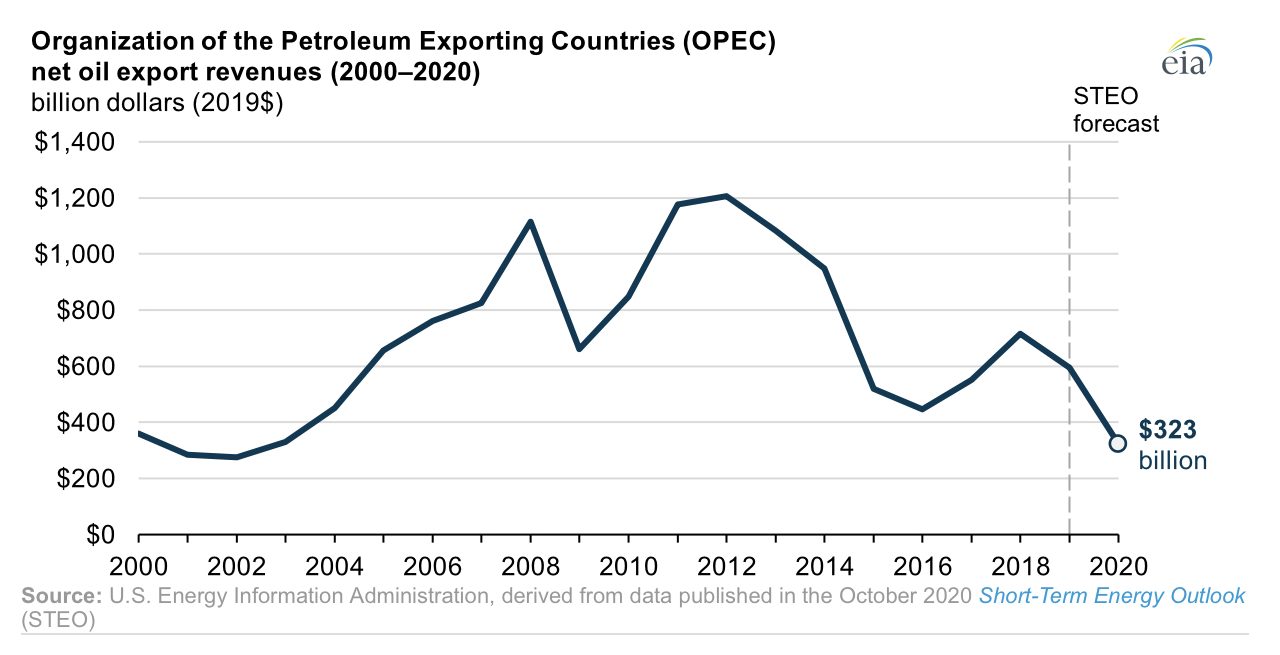
OPEC revenues lowest since 2002… EIA
Here is the EIA’s Today in Energy: “OPEC earned an estimated $595 billion in net oil export revenues in 2019, less than half of the estimated
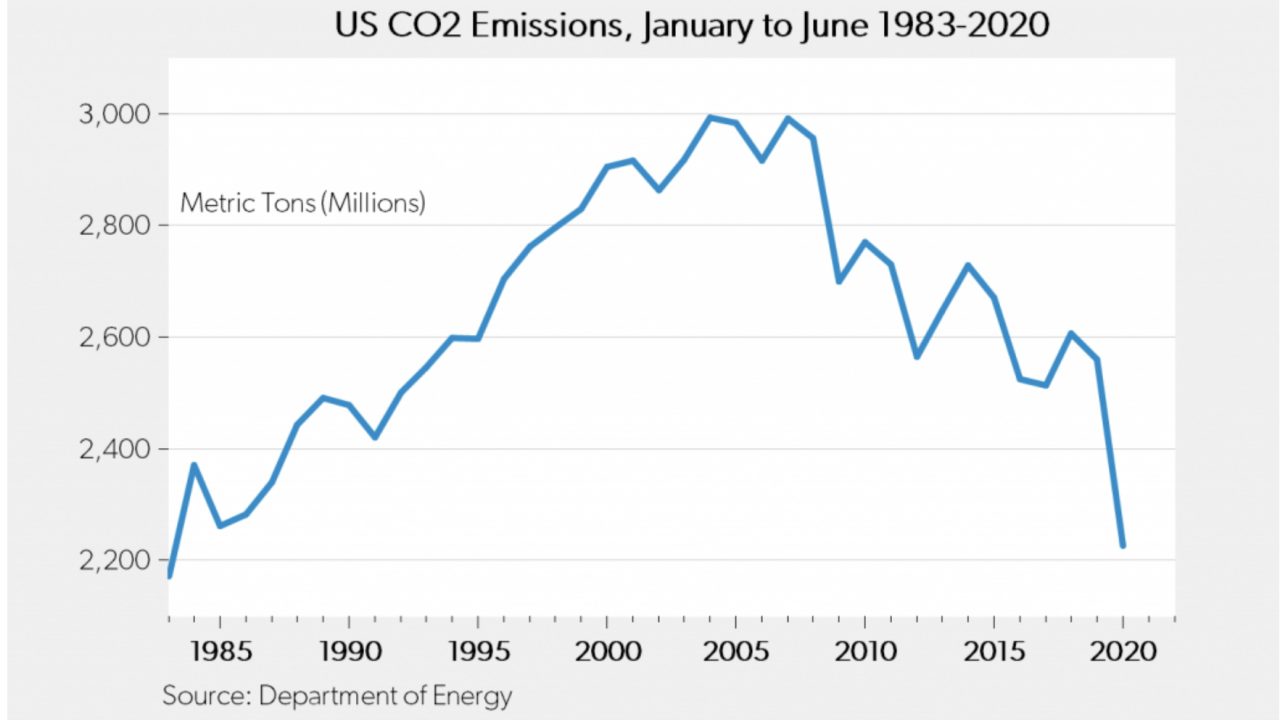
Gains in CO2 emissions… Carpe Diem
Carpe Diem has some nice charts on CO2 emissions... Most of the gains are due to natural gas displacing coal in electricity production, and, recently,
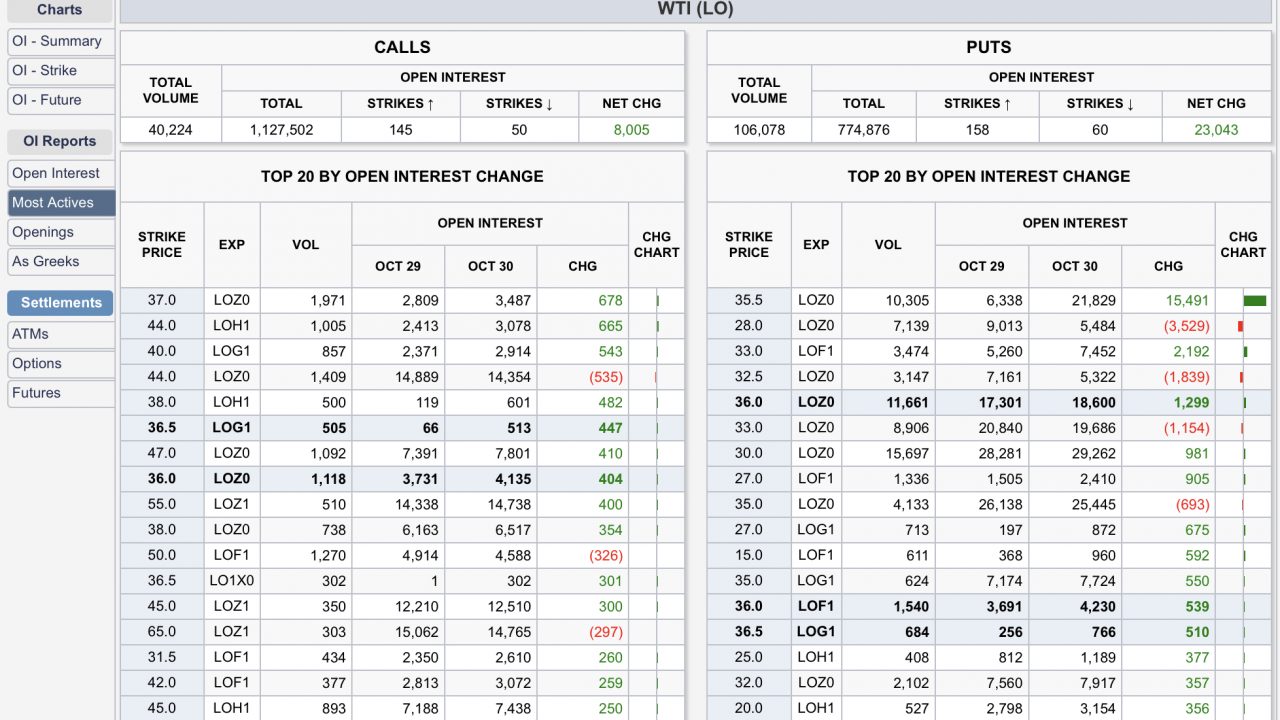
Most Active Strikes… CME
From the Chicago Mercantile Exchange, here are the most active WTI options (LO) strikes for Friday’s action:
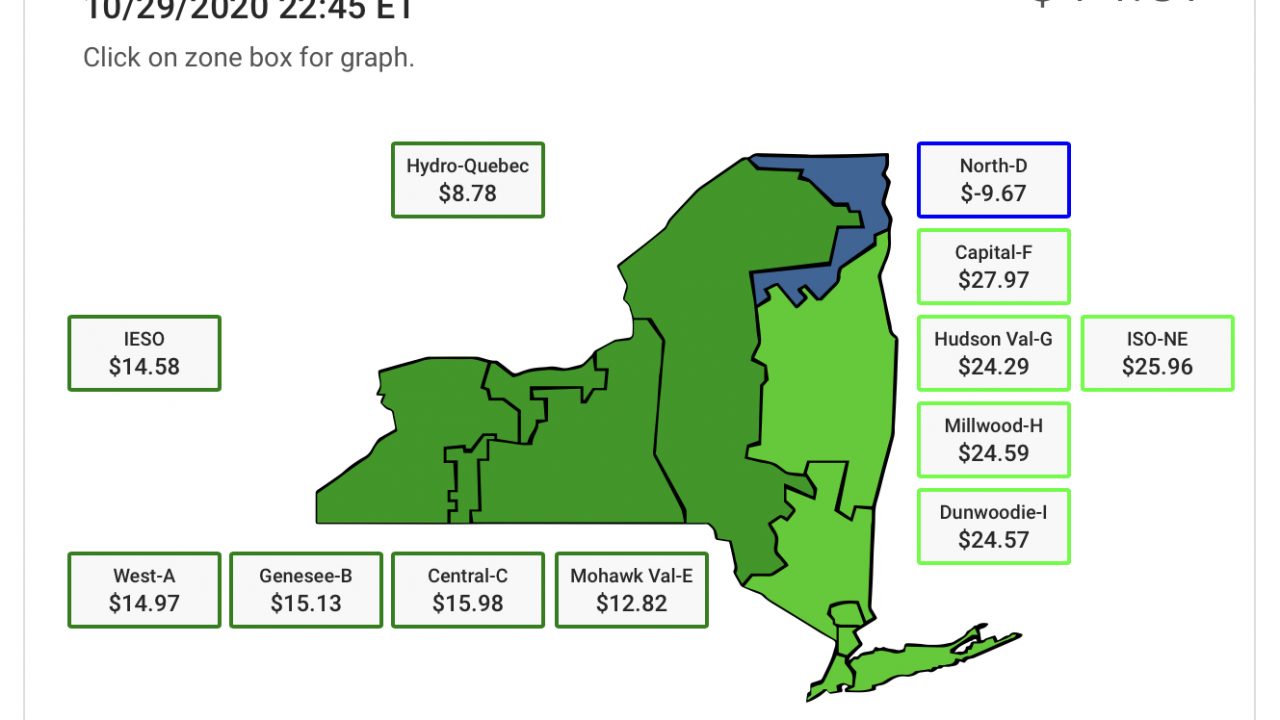
Negative commodity price…
Electricity prices often are negative in areas where supply can’t be stopped (hydro, nuclear, wind and, yes, oil) and demand wanes... Last night in my