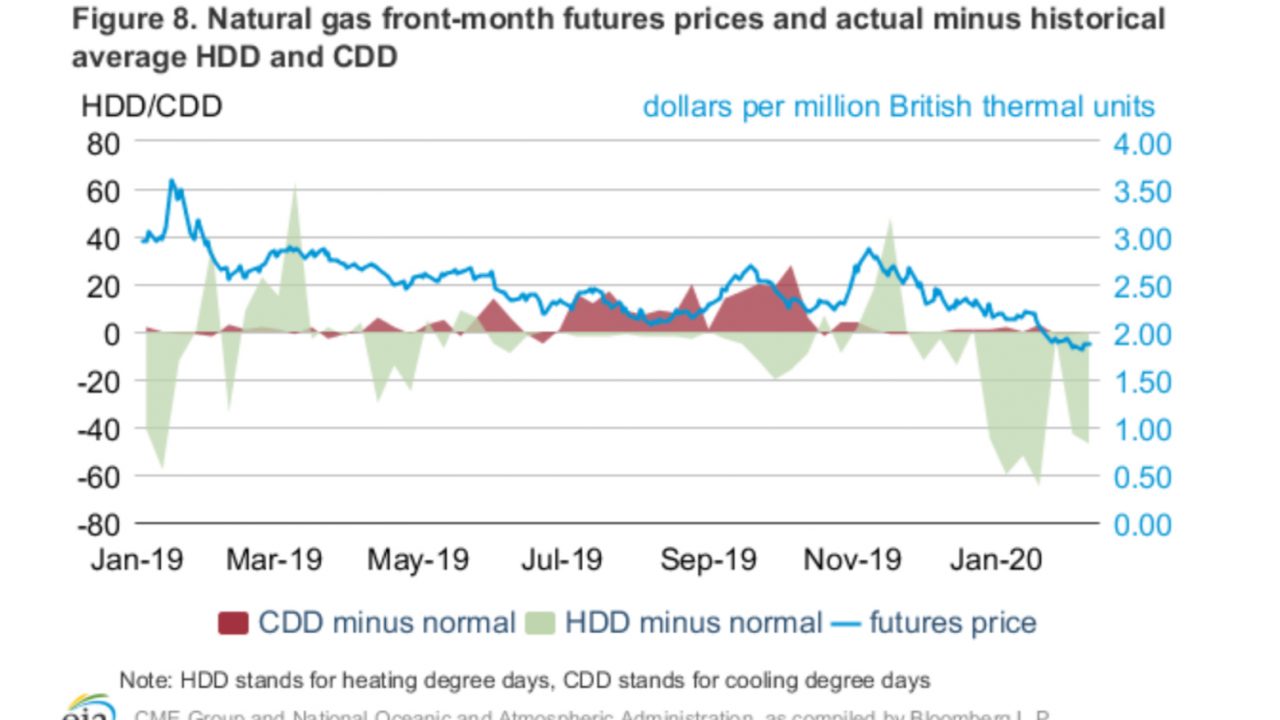
The EIA’s Short Term Energy Outlook, here, has a nice chart comparing heating degree days this winter vs. average and natural gas prices:
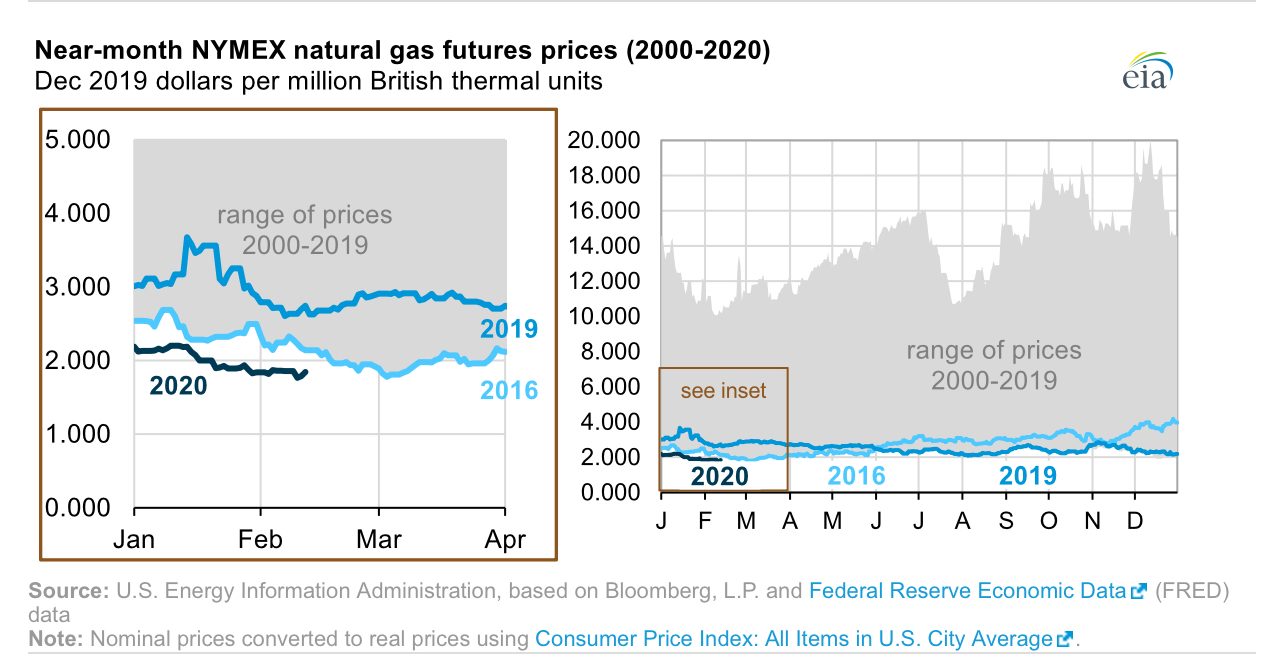
Natural gas prices fall to lowest Feb prices in 20 years… EIA
The EIA’s Today in Energy covers low natural gas prices: “Dry natural gas production in January 2020 averaged about 95.0 billion cubic feet per

Less money in the hands of CTA’s… Barclayhedge.com
From barclayhedge.com, here is a charge showing assets under management by commodity trading advisors.... The data can be found here...
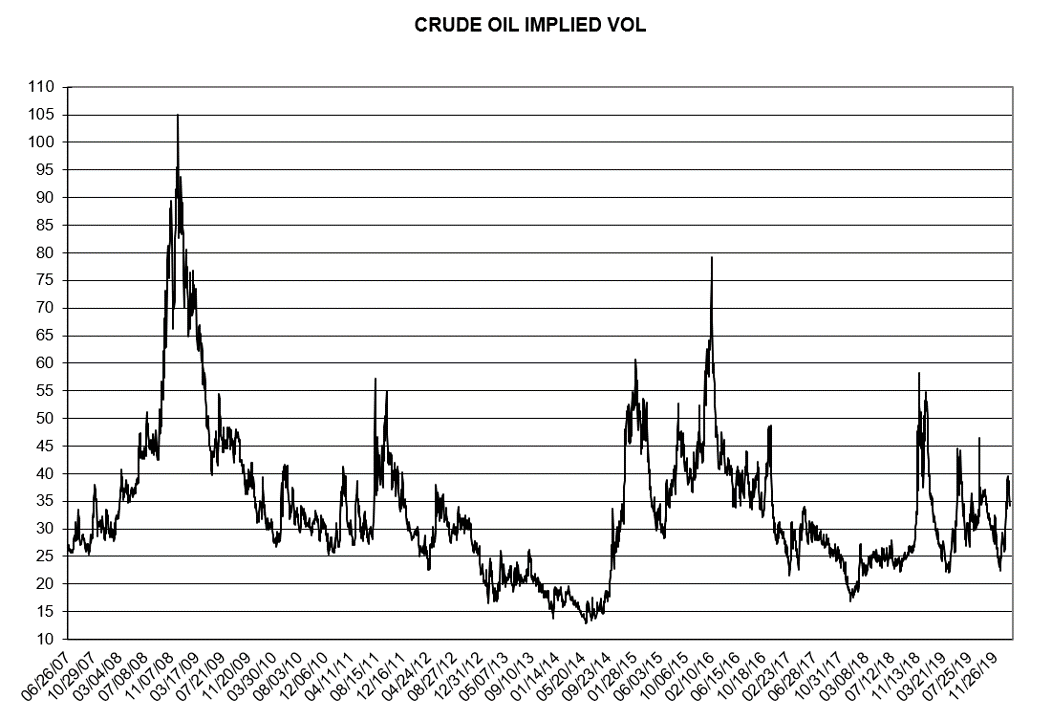
Vol update, WTI…
Here is an updated implied vol chart for WTI...
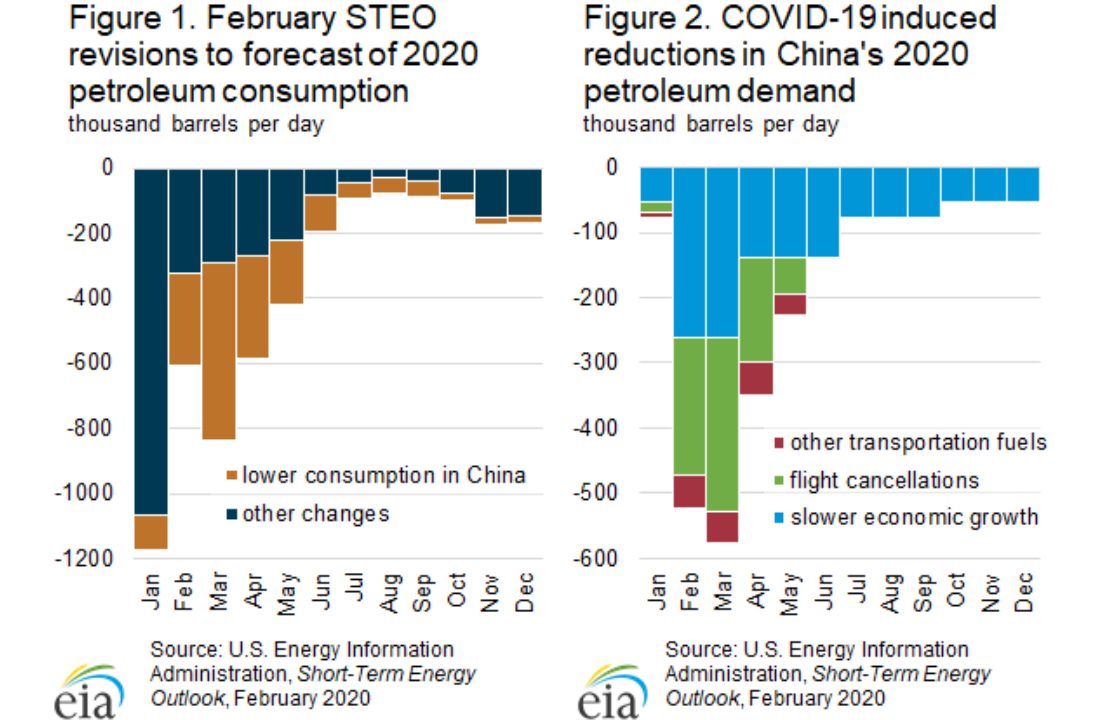
EIA revises global growth estimates down… EIA
Here is the EIA on their global demand estimates for 2020: ”the U.S. Energy Information Administration (EIA) forecasts that global liquid fuels
Saudi-Russian Alliance, Oil Demand… NYTimes
Stanley Reed, NY Times, has a nice piece on the Saudi-Russian alliance and the coronavirus, here... On getting to an agreement to cut: “Saudi
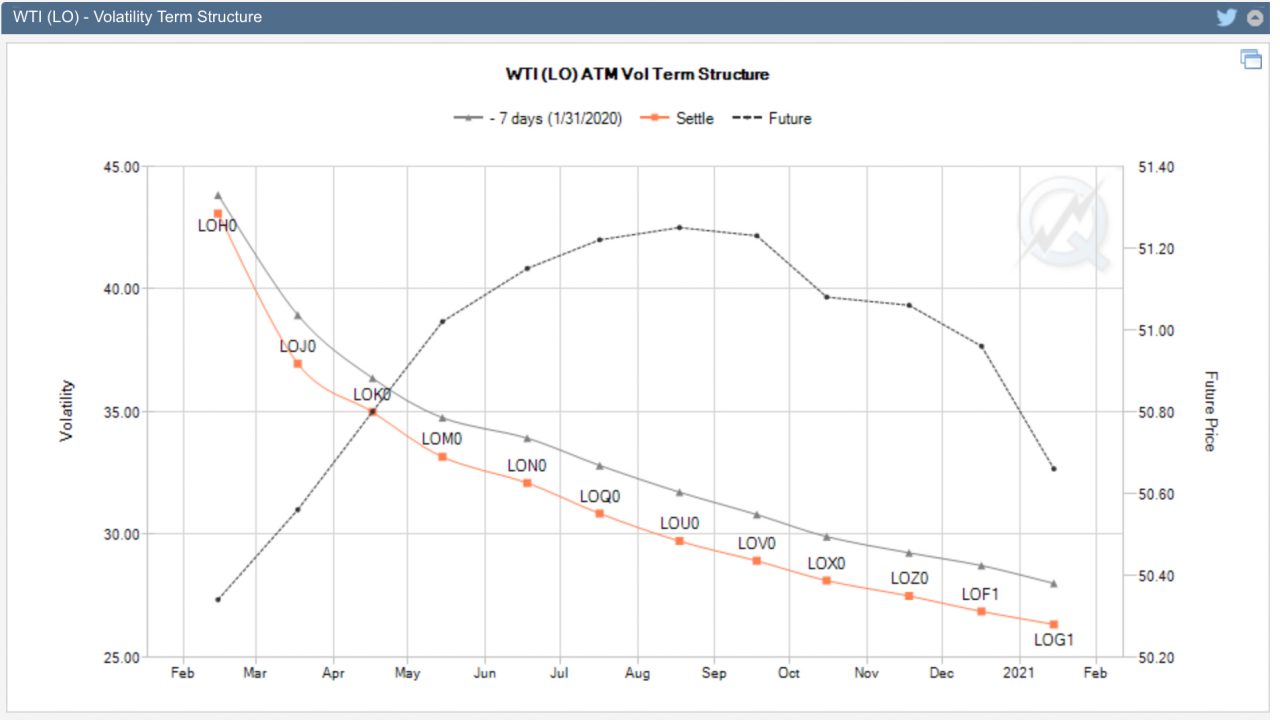
Term structure of oil… CME
From the CME, here is a look at the oil curve, along with the implied vol curve...
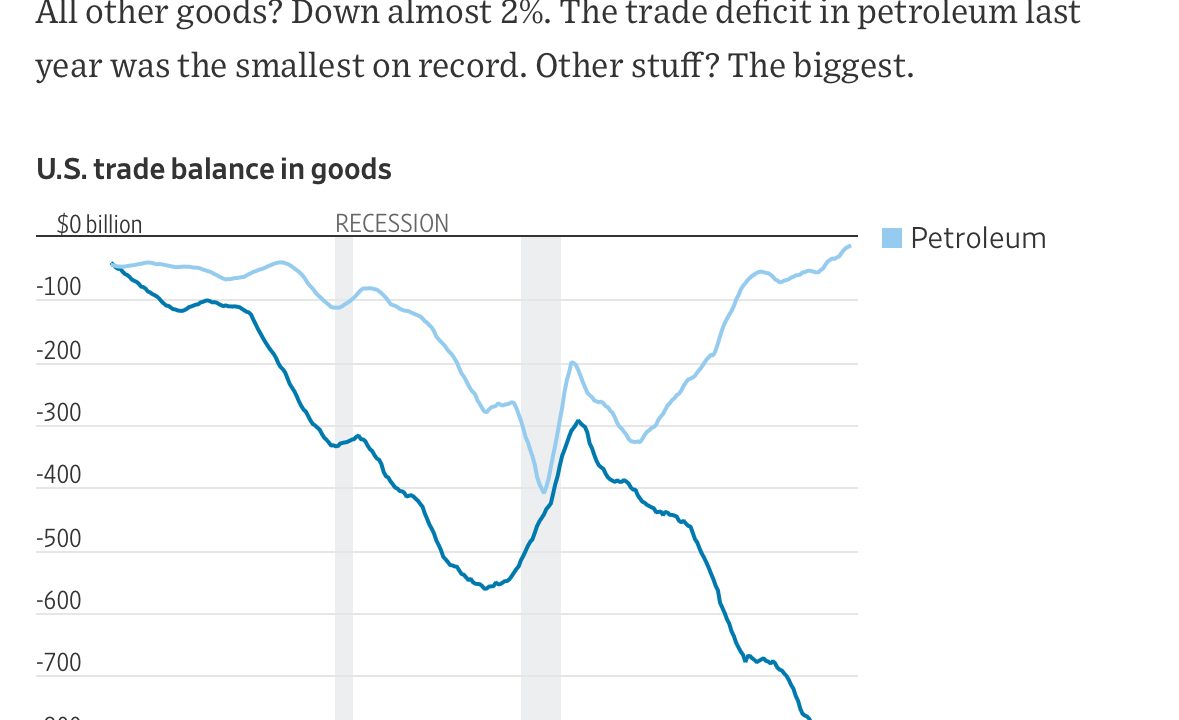
Petroleum/non-petroleum trade deficit… WSJ
From the Wall Street Journal, here:
China energy executives braced for 25% fall in domestic oil demand… FT
Sun Yu, Anjli Raval and David Sheppard, Financial Times, paint a bleak picture on the prospects of oil demand in China, here...