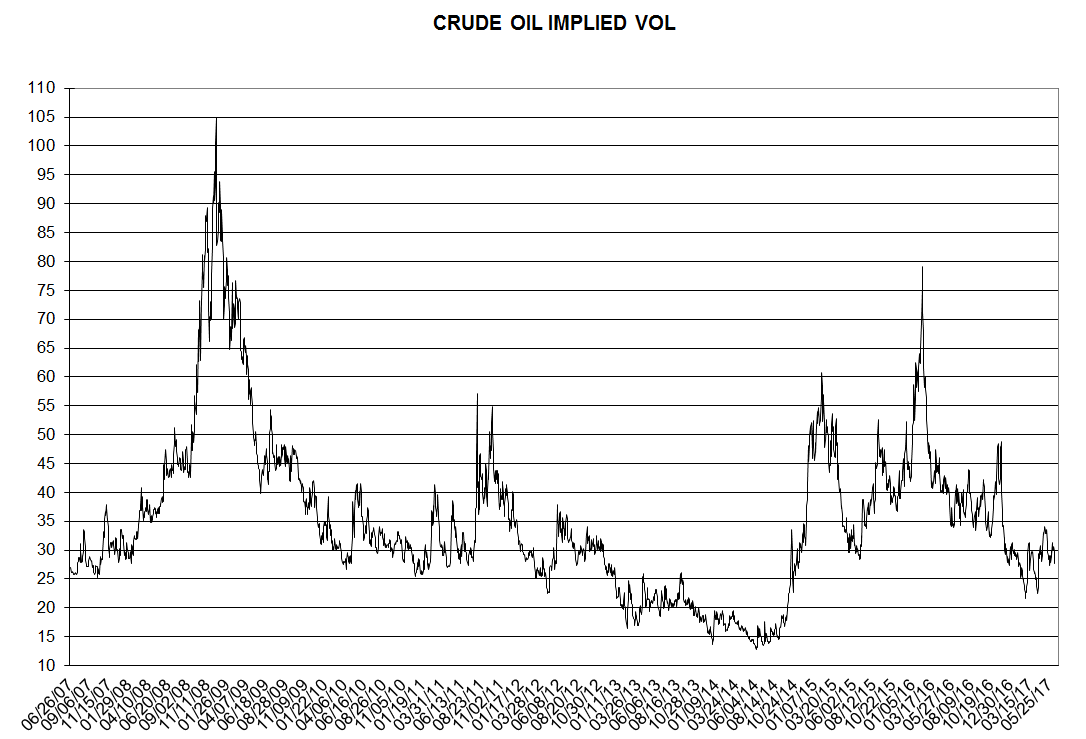
Here is a chart of WTI crude oil implied volatility through and including Friday, June 16th... The series is based on implied vol of the at the money,
Days supply for crude oil, gasoline, distillates… EIA
I like looking at energy stock levels in context with demand... Below are charts showing "days supply" (or stocks divided by daily demand) for crude
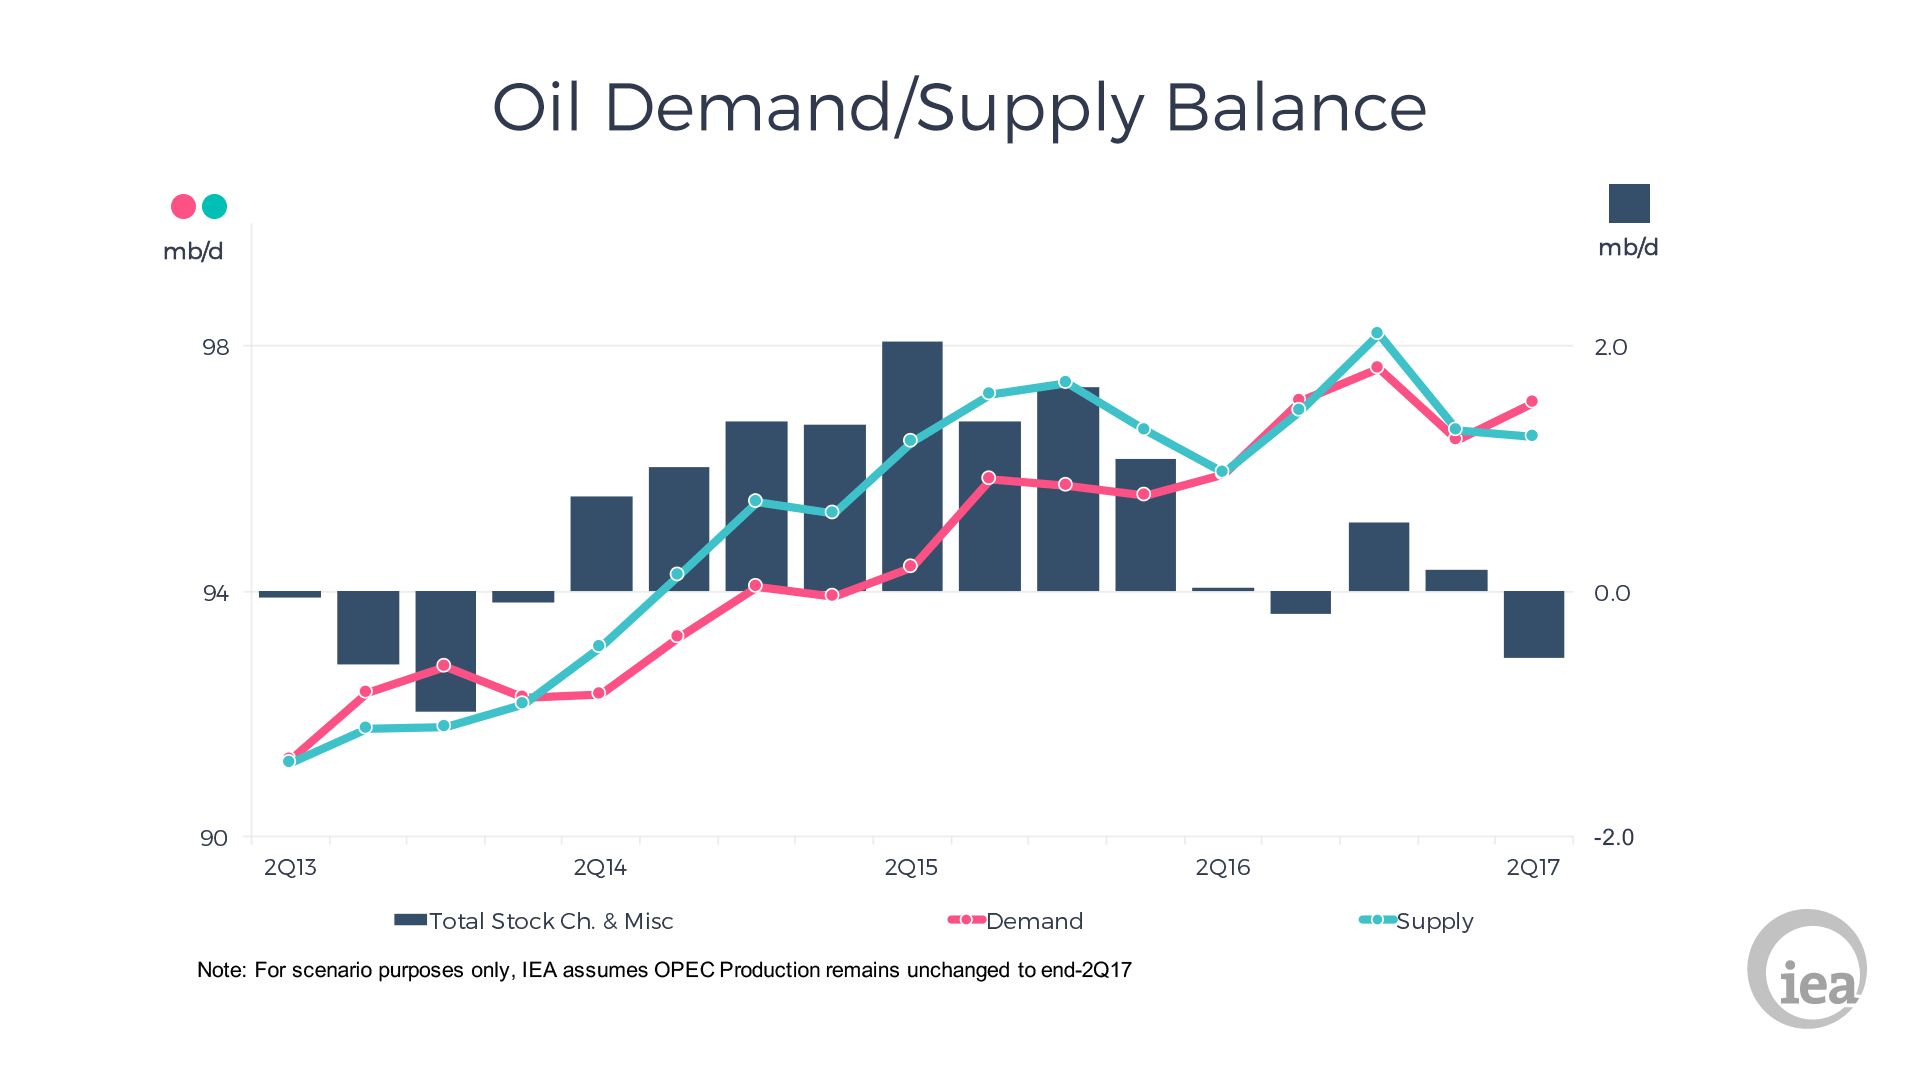
Oil Market Report Summary… IEA
The IEA's monthly Oil Market Report was released yesterday... Here are some highlights (my bold): "Based on our current numbers, assuming stable

Gasoline’s Unusual Summer Stockpile Surge… Bloomberg
Laura Blewitt, Bloomberg, gets right to the point: "Gasoline inventories are moving in the wrong direction this summer, rising the most in the
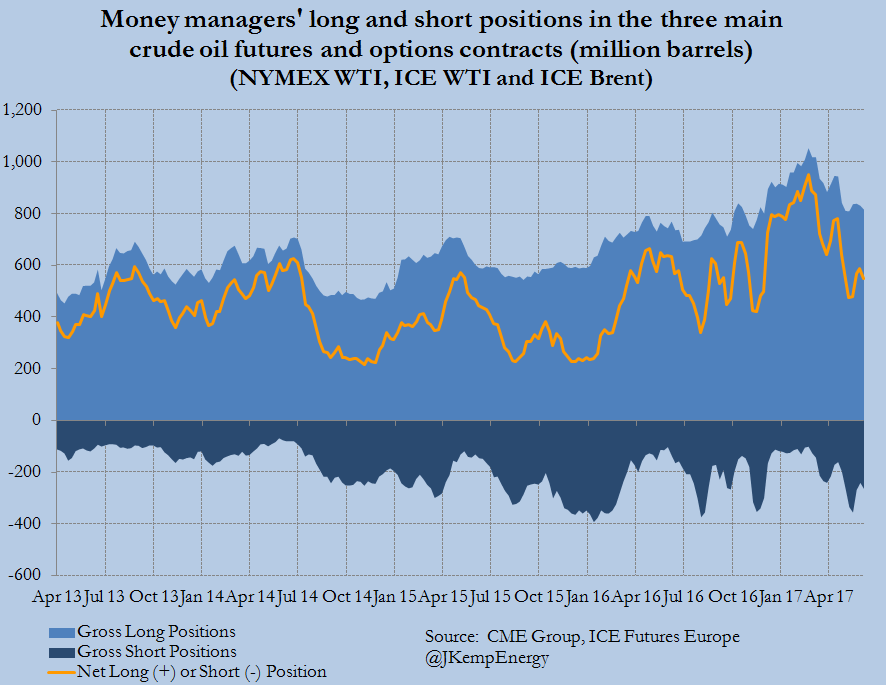
Hedge funds remain cautious on oil…Reuters
From John Kemp, Reuters: "Hedge funds remain cautious on the outlook for oil prices despite confident statements from Saudi Arabia that global oil
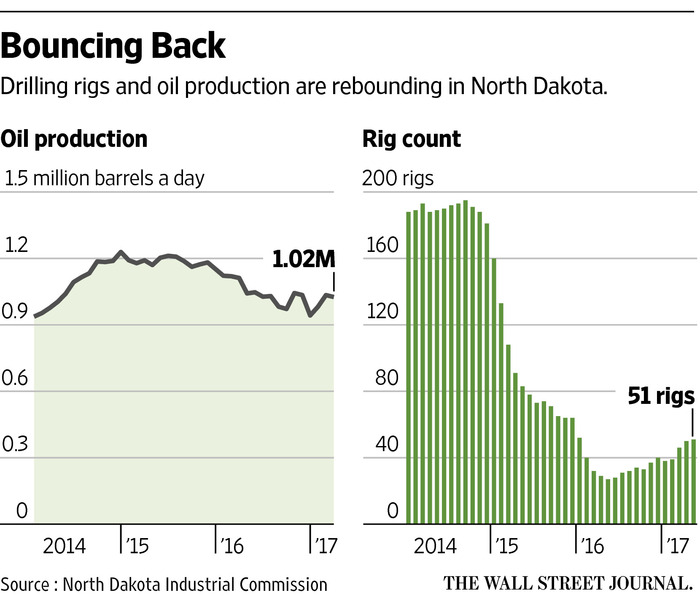
Drilling rigs, oil production bouncing back in North Dakota…. WSJ
North Dakota oil production is back up to 1.2 mbd... Here is the Wall Street Journal link:
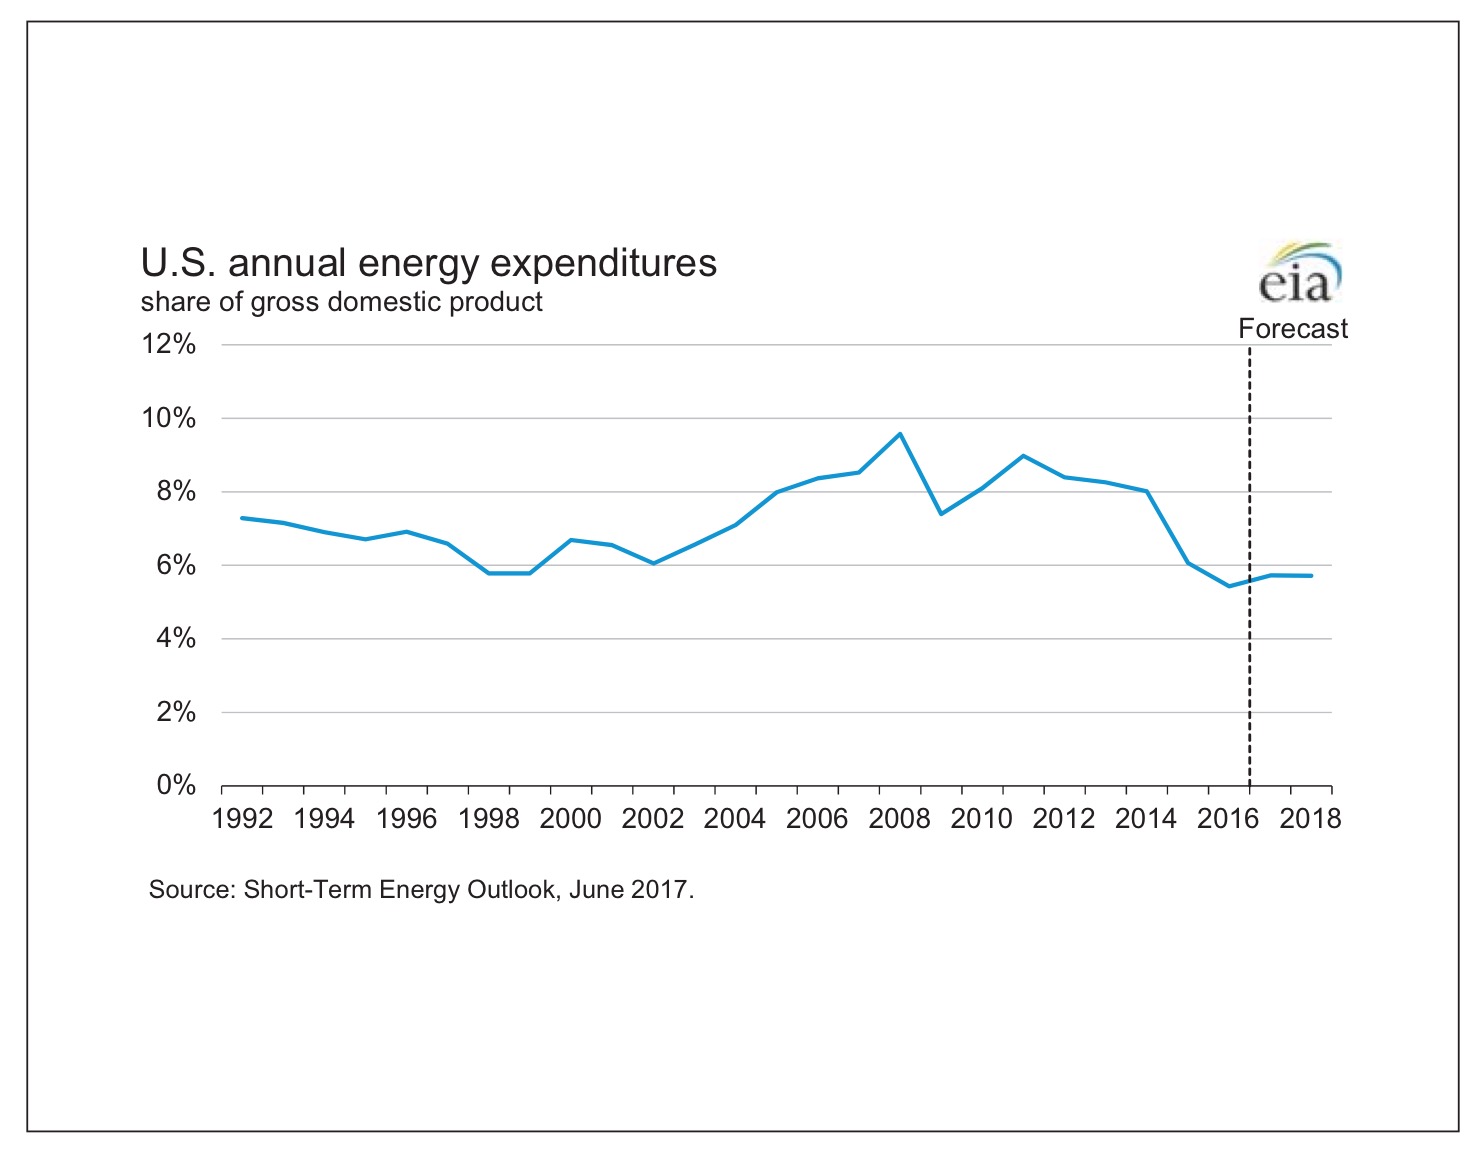
Annual energy expenditures… EIA
From last week's Short Term Energy Outlook, U.S. energy expenditures as a share of GDP: This, of course, means more income to spend on stuff
Returning to earth… Atlanta Fed GDP Now
The Atlanta Fed's GDP Now forecast is down to +3.0%, still respectable, but down from an earlier
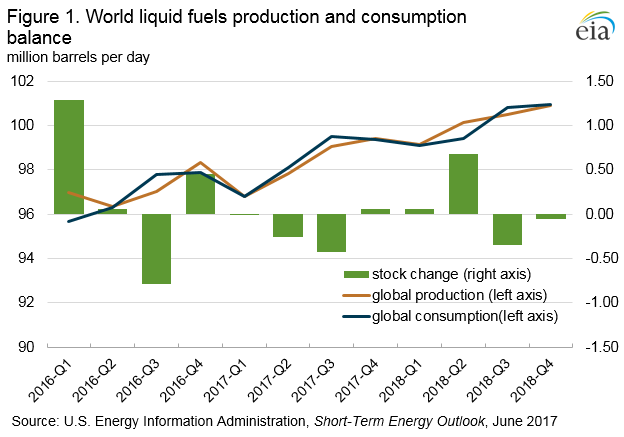
Supply/demand balance… EIA
From This Week in Petroleum, from the EIA, their expected supply/demand balance estimate: Note the stock draw expected this quarter and next...