Here is a chart of WTI crude oil implied volatility through and including Friday, June 16th… The series is based on implied vol of the at the money, second nearby option:
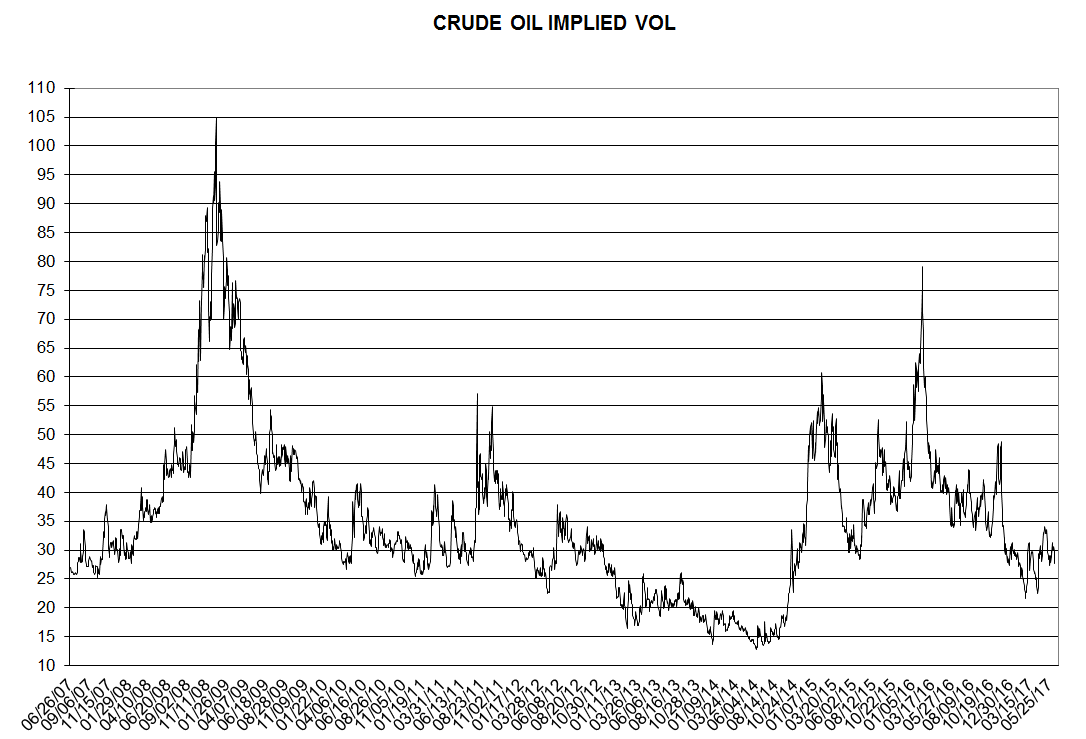
The chart goes back to 2007 illustrating many spikes in volatility.. Lower prices are correlated with higher vol… Note that the low in the chart occurred a few months before crude oil prices collapsed… The long term average implied volatility is around 33%… Average daily volume in May (with an OPEC meeting) was 241,396, compared with a year to date number of 186,793…
Leave a Reply