From the EIA's "This Week in Petroleum", these charts show how US stock levels compare to 5 year highs and lows:
Oil options udate…
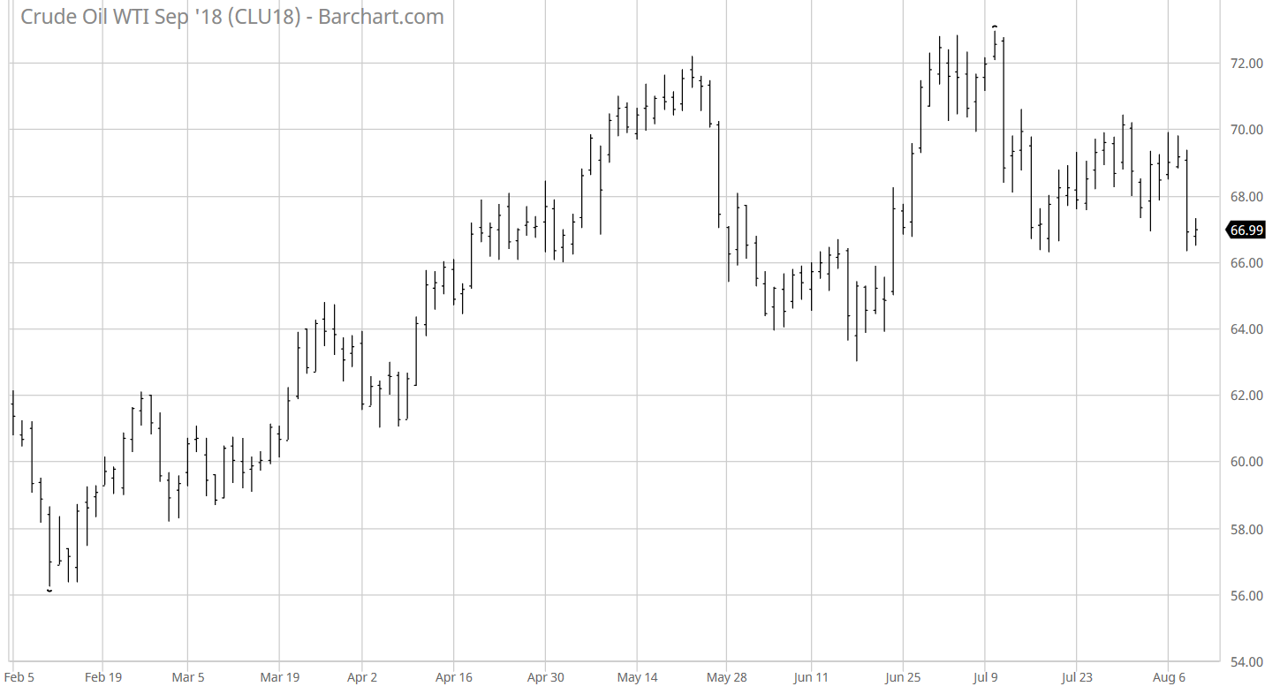
Volume in WTI options picked up significantly yesterday and volatility moved up about a point to settle at 24.4 (second month out)... Not surprising
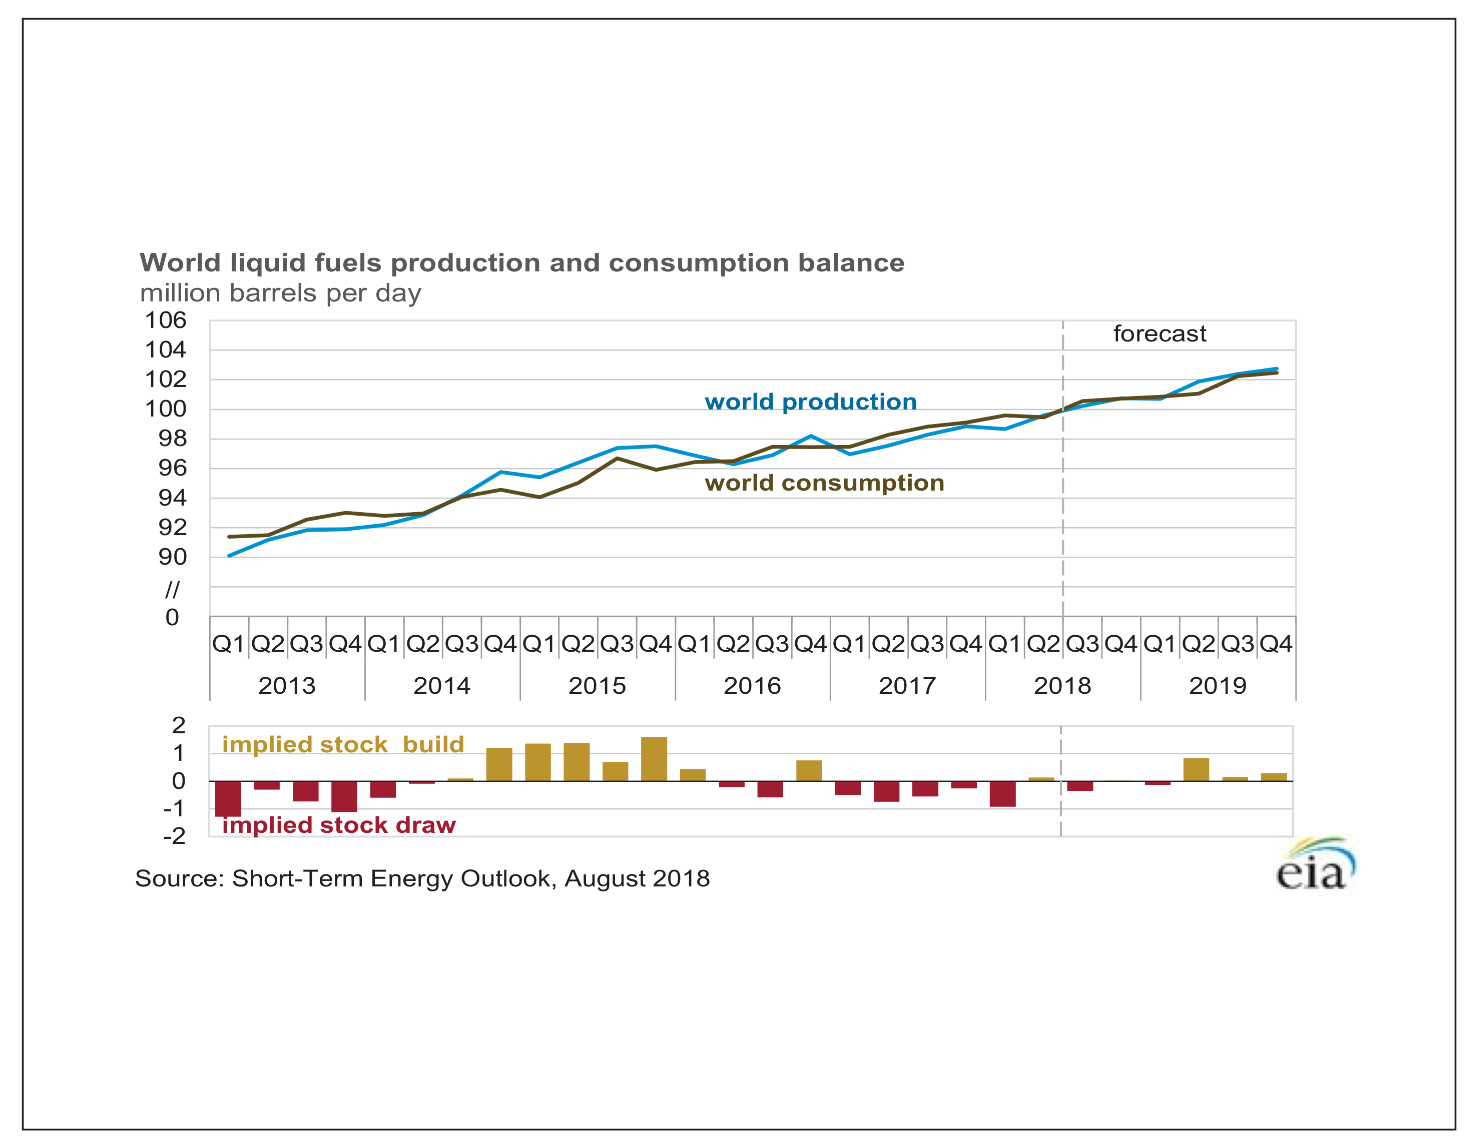
Supply/Demand balance… EIA
The EIA’s Short Term Energy Outlook shows a market mostly in balance through 2019... We know that won’t happen...
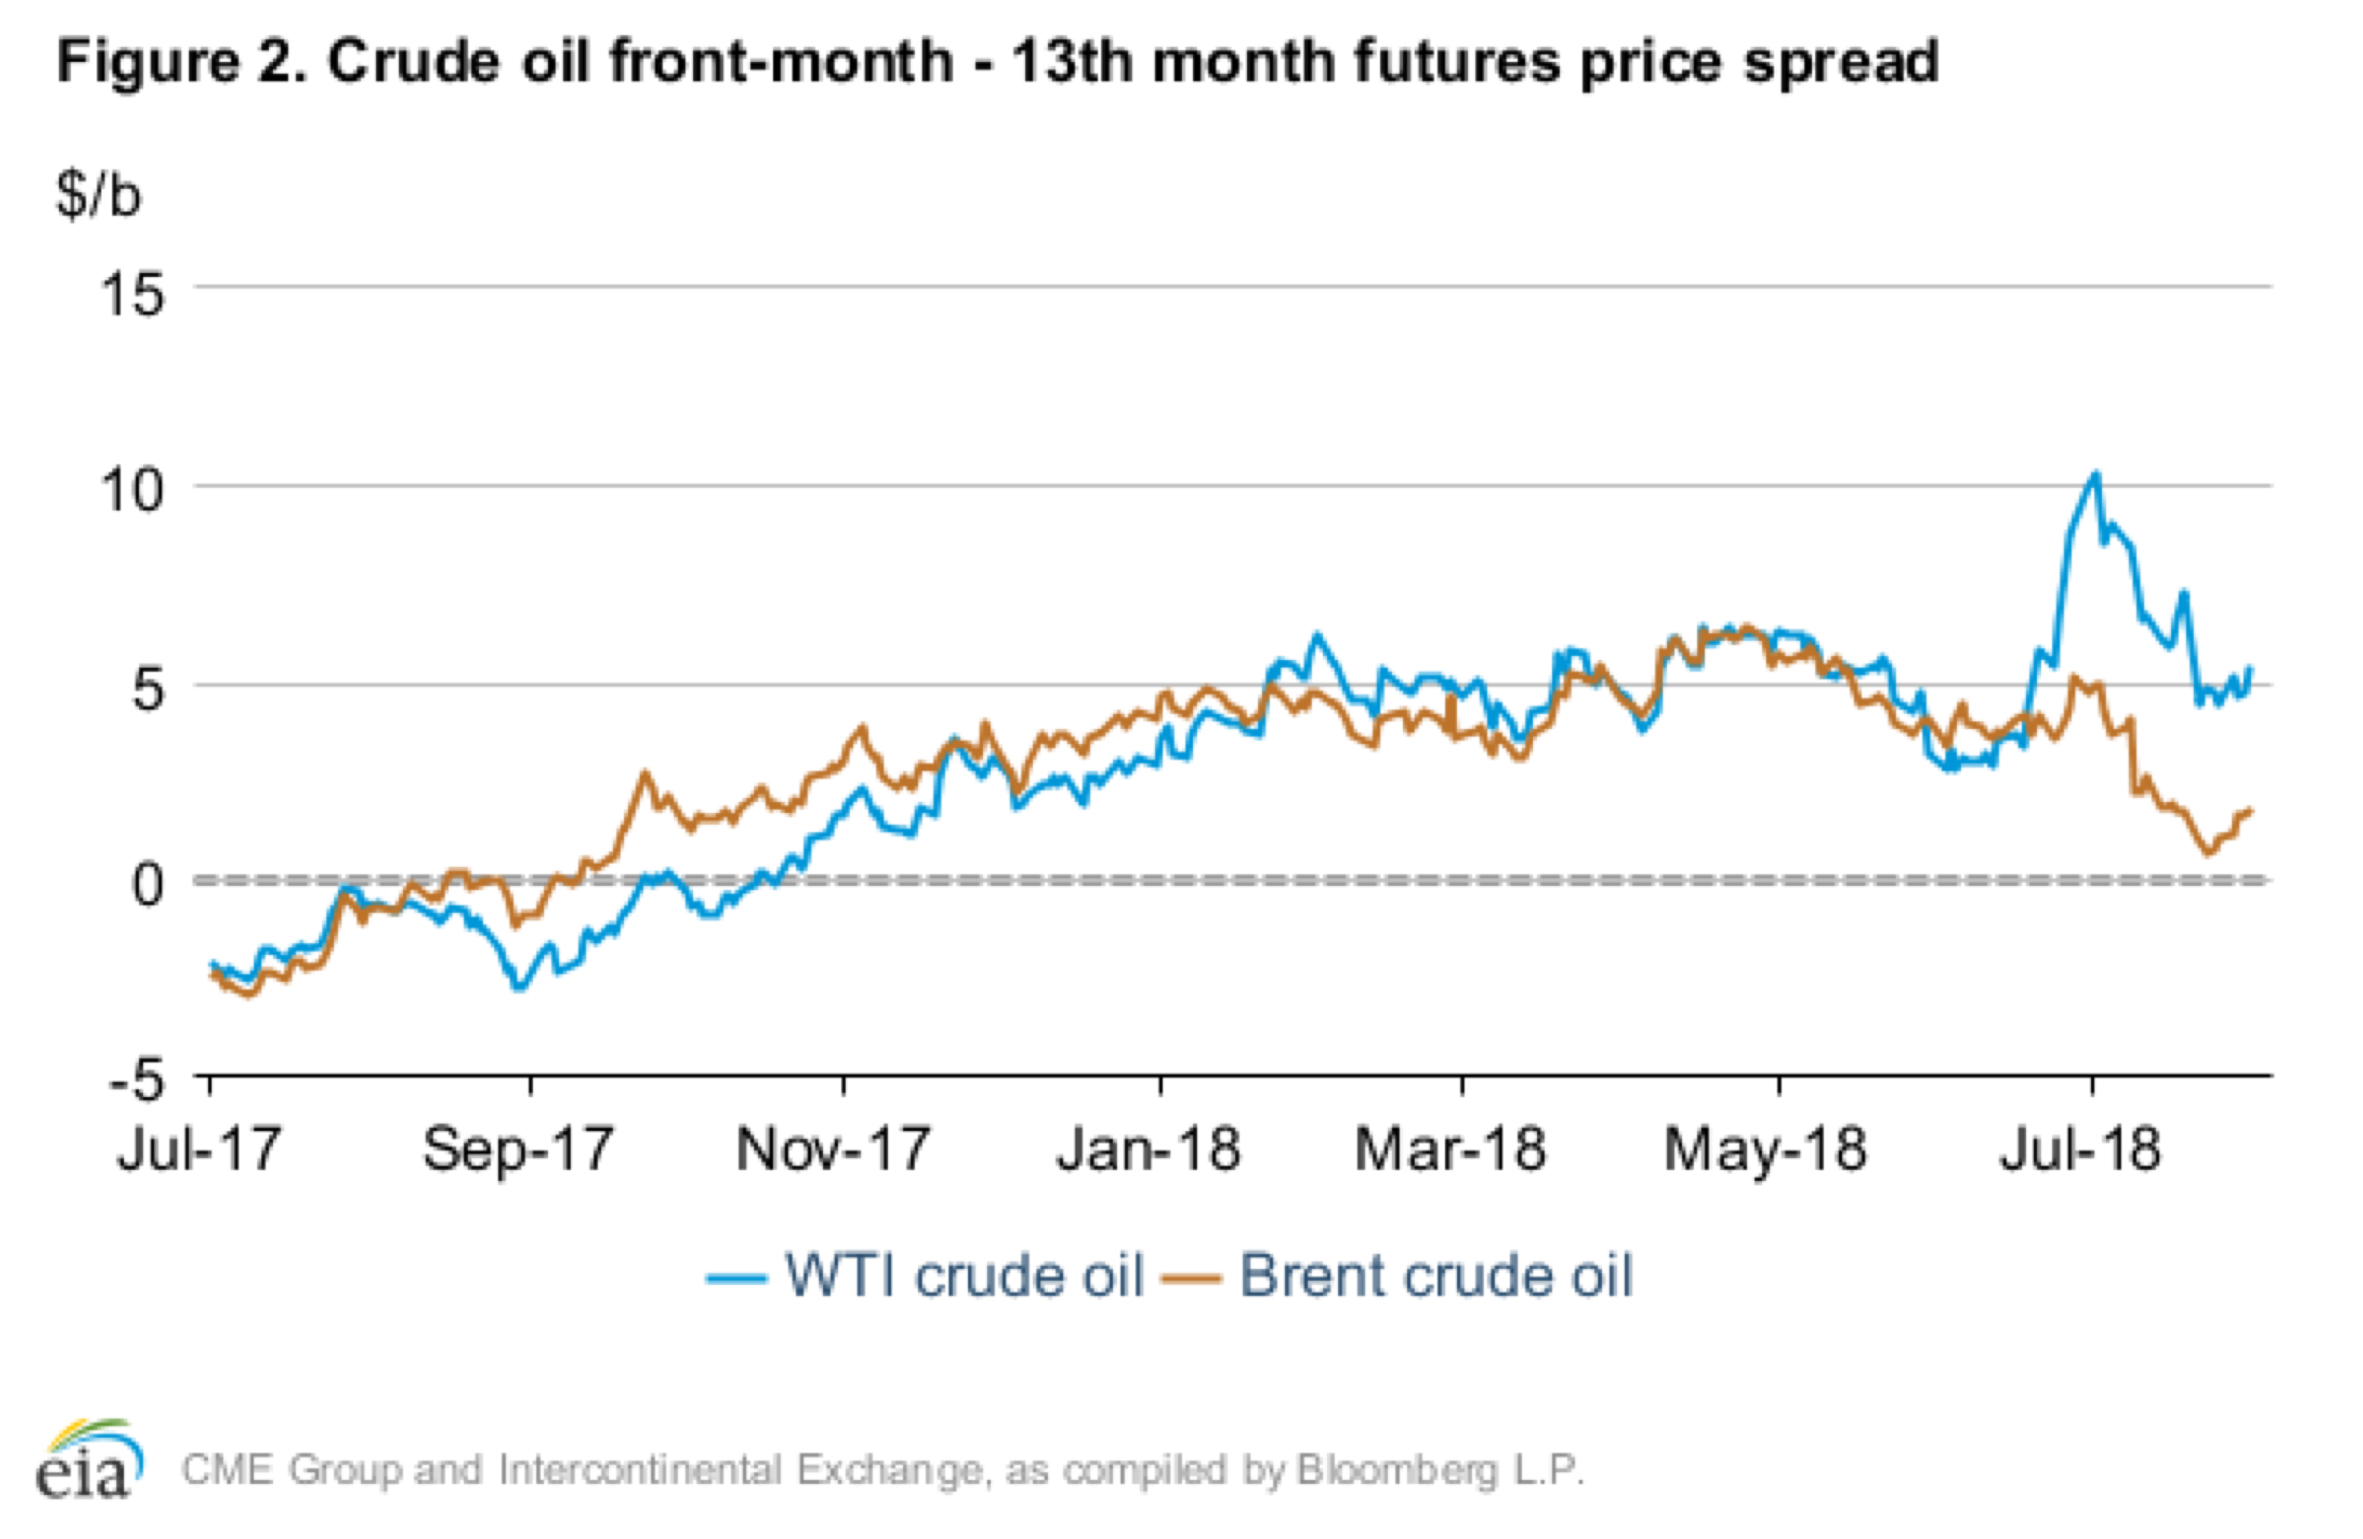
Brent, WTI time spreads take a different path… EIA
This chart is from the EIA’s Short Term Energy Outlook, release today: Strong refinery runs in the mid-continent and a major Canadian supply
Dr. Ed on yields…
Dr. Ed Yardeni explains the tug of war in the bond market: http://blog.yardeni.com/2018/08/tug-of-war-in-bond-market.html Reminder: check in on
Supply Chain Adjustments…
Clyde M. Russell, Reuters, has a nice piece, here, on the changing oil trade routes due to the China/US trade dispute and sanctions imposed on
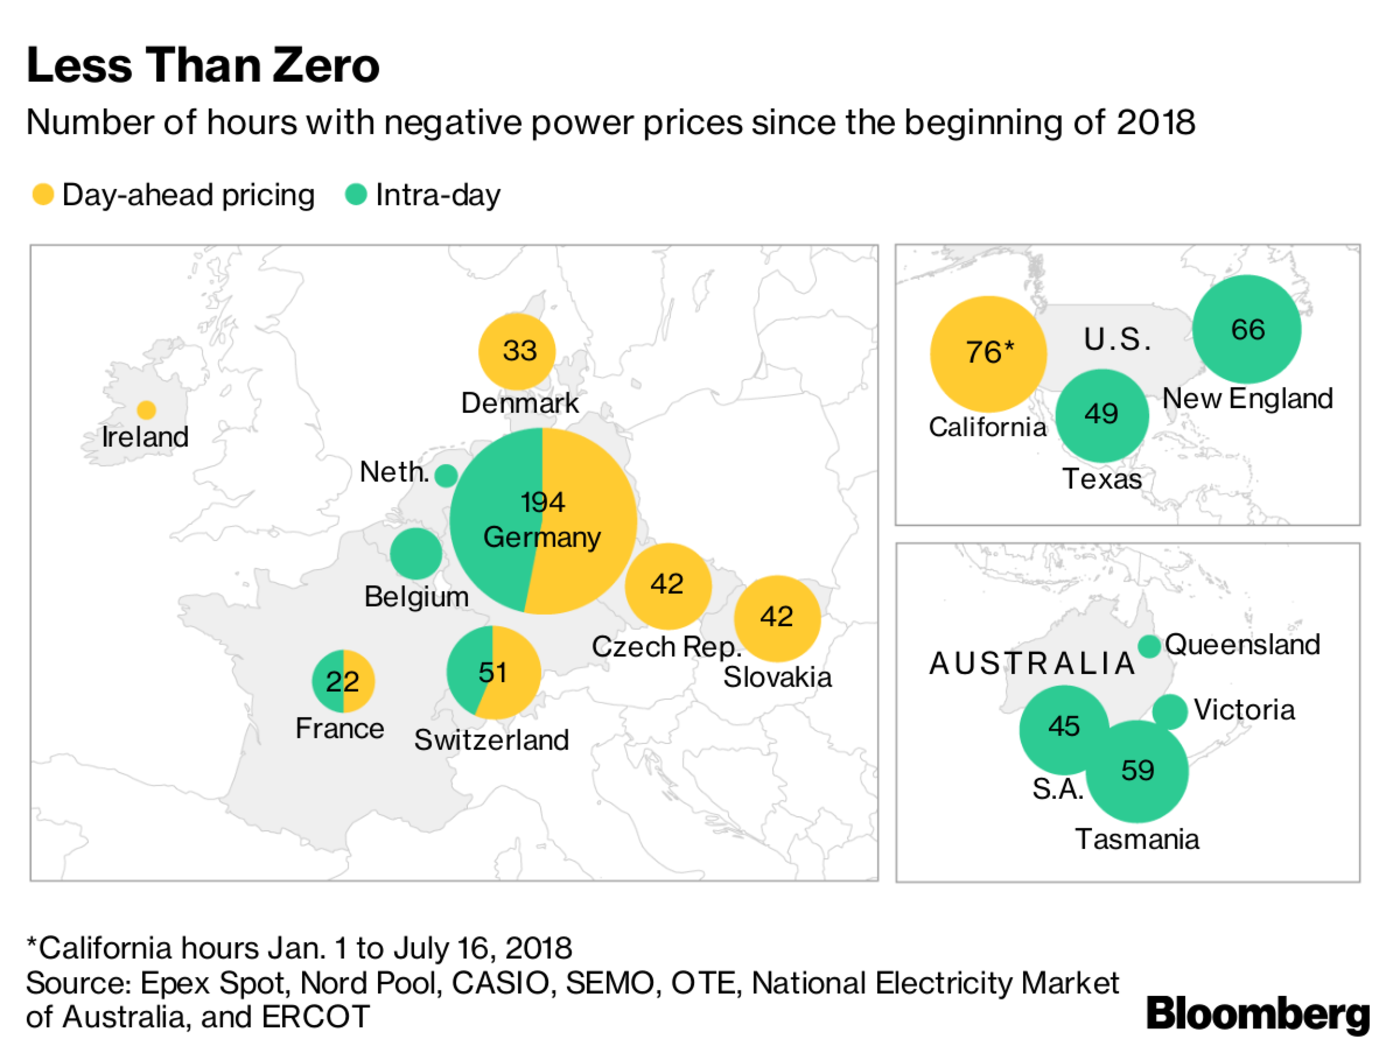
Power Worth Less Than Zero… Bloomberg
Here is an excellent piece from Bloomberg on the spreading of negative power prices... ”With wind and solar farms sprouting up in more areas -- and
Vitol’s Ian Taylor… Financial Times
Interesting throughout...
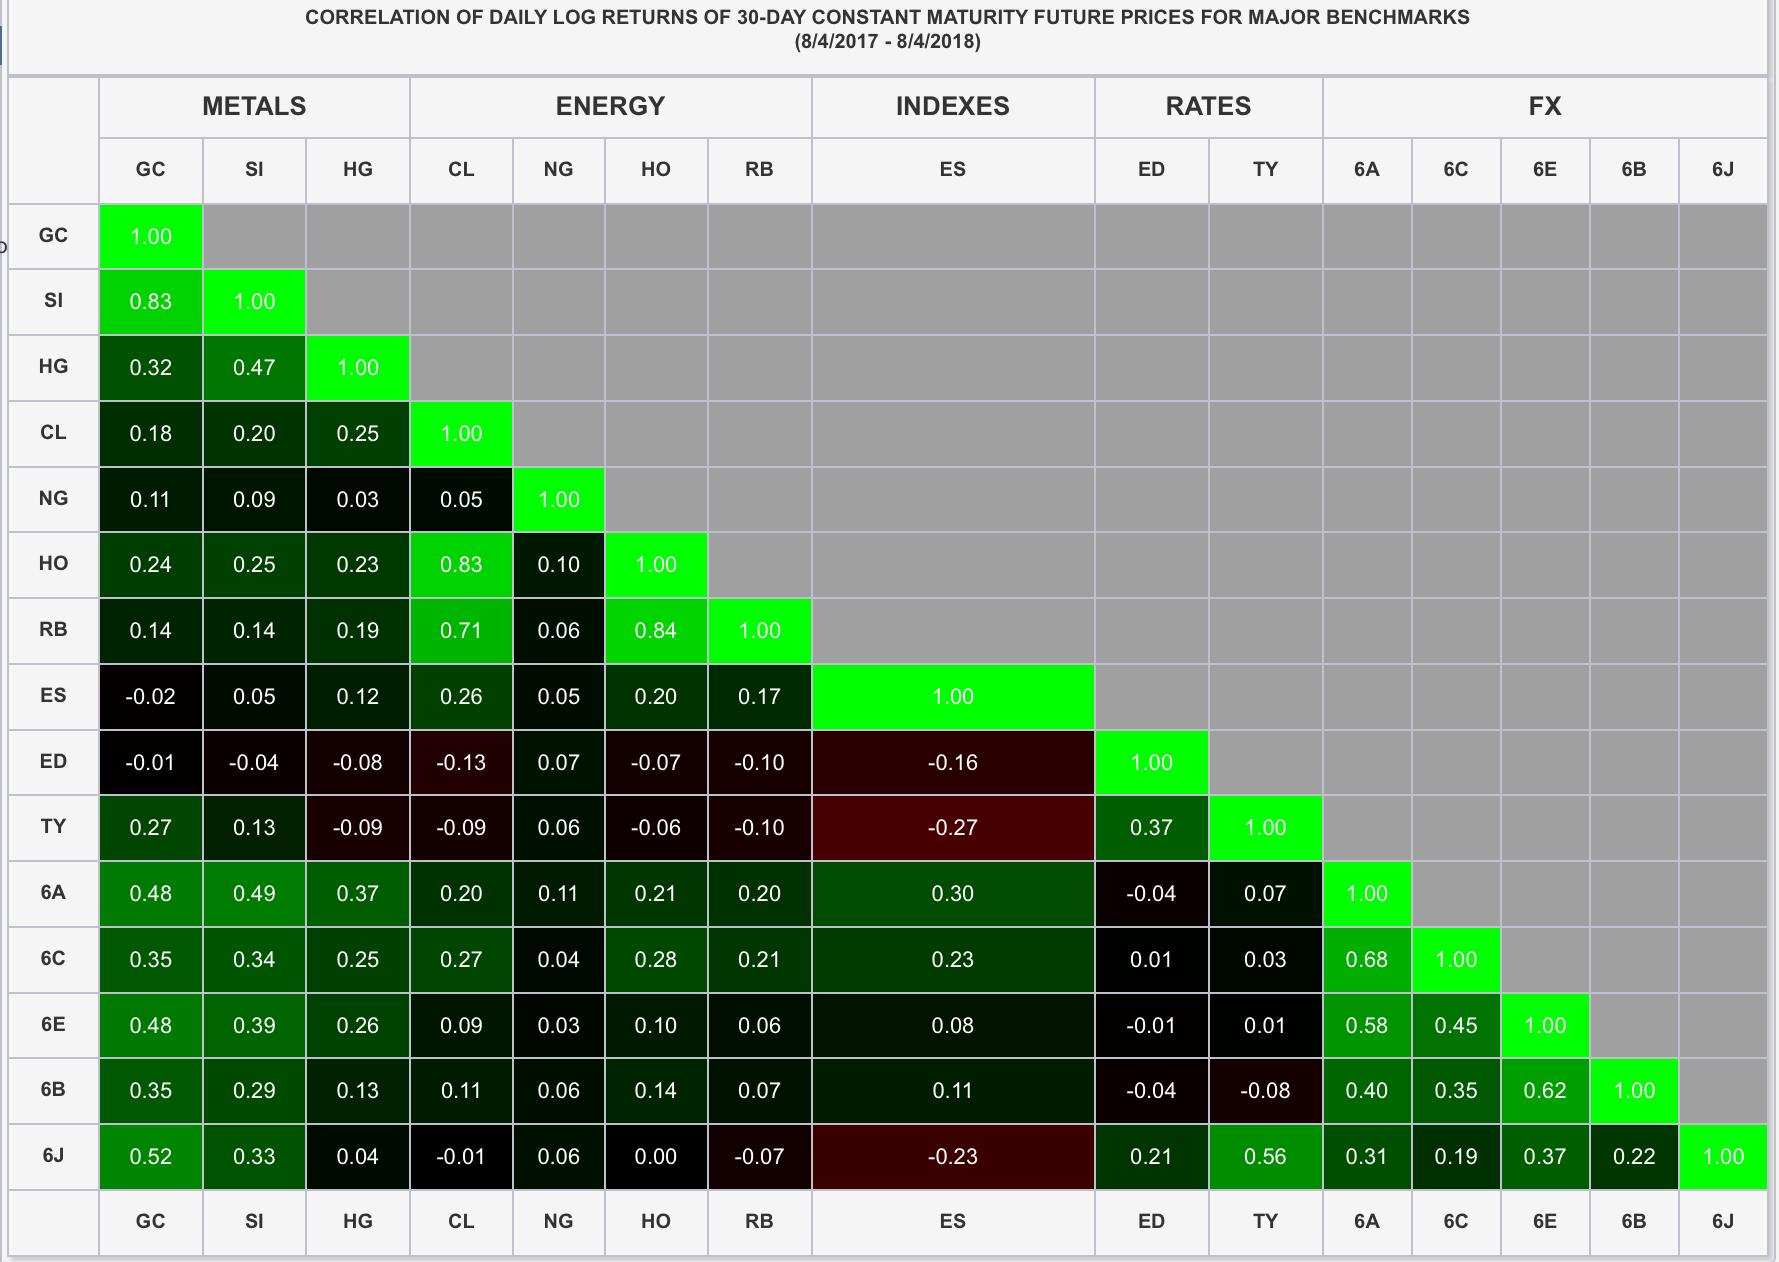
Cross-Asset Correlation… CME
Despite the often quoted analysts who explain a price change in oil as a reaction to a change in the dollar, the CME’s correlation tool here, shows