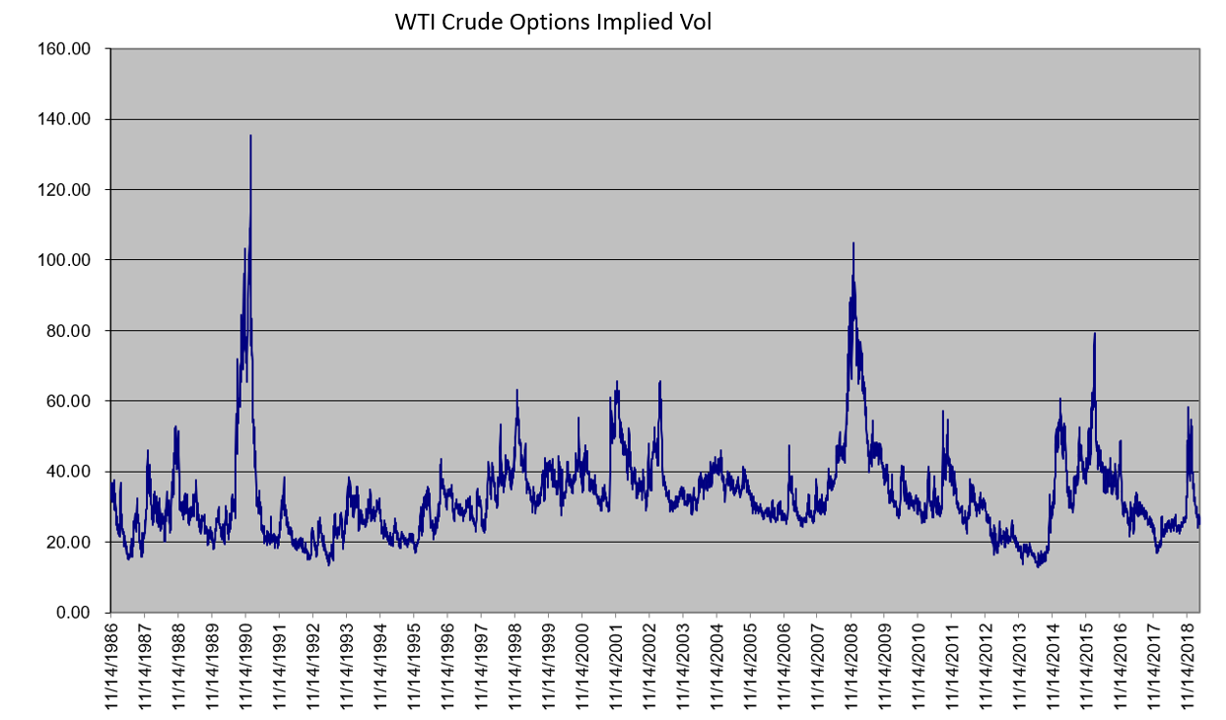
Options update… WTI crude oil options traded a measly 97,597 contracts per day in March, which, year to date, is down 41.1%… Lots of talk going on concerning oil price, but little action… Implied vol was at 53 on Jan 2, now is at 25%… Implied vol abhors a balanced market… Here is a long term chart of implied volatility from 11/14/1986 through 3/29/2019… The first big spike is from Gulf War I settling at 135.4 on 1/14/1991 (many strikes approaching a .5 delta was one of many oddities at the time)… The low was on 6/6/2014 at just under 13%…. (All based on my numbers, not guaranteed to be accurate…) The long term average is 32.8% (should there be any mean reversion traders left…)… I would love to hear what part of the chart you entered the market and in what capacity… Jim
Leave a Reply