
The Wall Street Journal’s The Daily Shot has some interesting price charts (and comments):

US oil stock levels… EIA
From This Week in Petroleum, here are stock levels compared to 5 year min/max: And here are stock levels divided by daily demand, or days
US shale hedging surges… Reuters
From Catherine Ngai, Reuters: “When oil prices rocketed towards $60 a barrel this fall, U.S. shale producers hedged more barrels of oil during the

Yields move higher…
Here are a couple of charts showing long term interest rates and “real” rates pulled from the WSJ’s The Daily Shot:
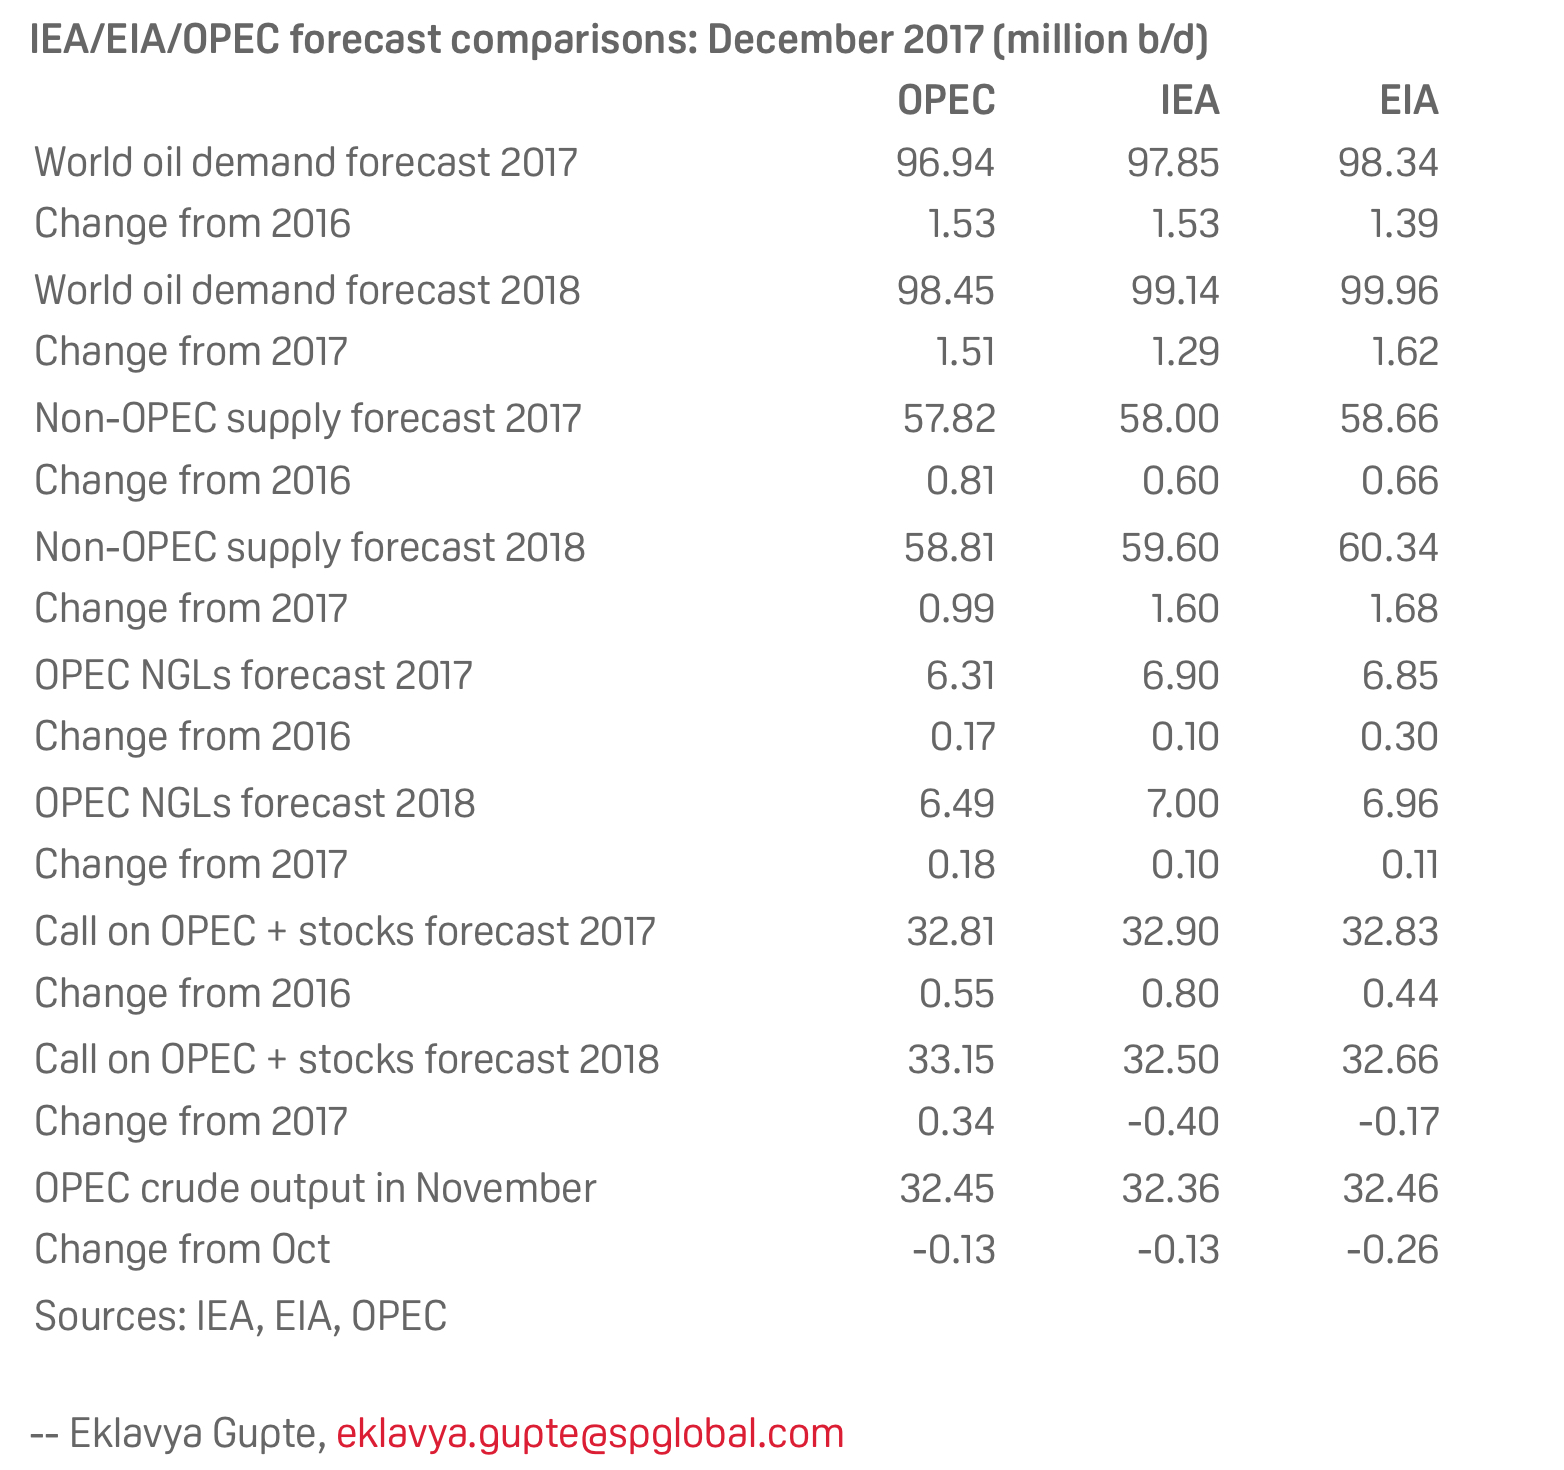
Forecasters offer differing outlooks for 2018…Platts
Here is Platt’s comparing the big 3 monthly oil reports from OPEC, the International Energy Agency and the Energy Information Agency (of the US

Welcome to the Gutenberg Editor
The goal of this new editor is to make adding rich content to WordPress simple and enjoyable. This whole post is composed of pieces of
Ritholz interviews Jeff Sherman, Doubleline
Ritholz interviews Jeff Sherman, and it’s excellent! http://ritholtz.com/2017/12/transcript-mib-interview-jeff-sherman-doubleline/
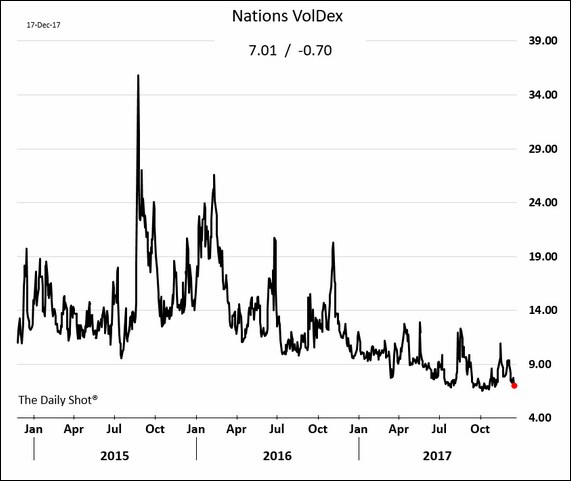
Volatility is dead everywhere… Daily Shot… WSJ
The WSJ’s Daily Shot shows volatility declining across the board... Here is a measure of vol for various asset classes:
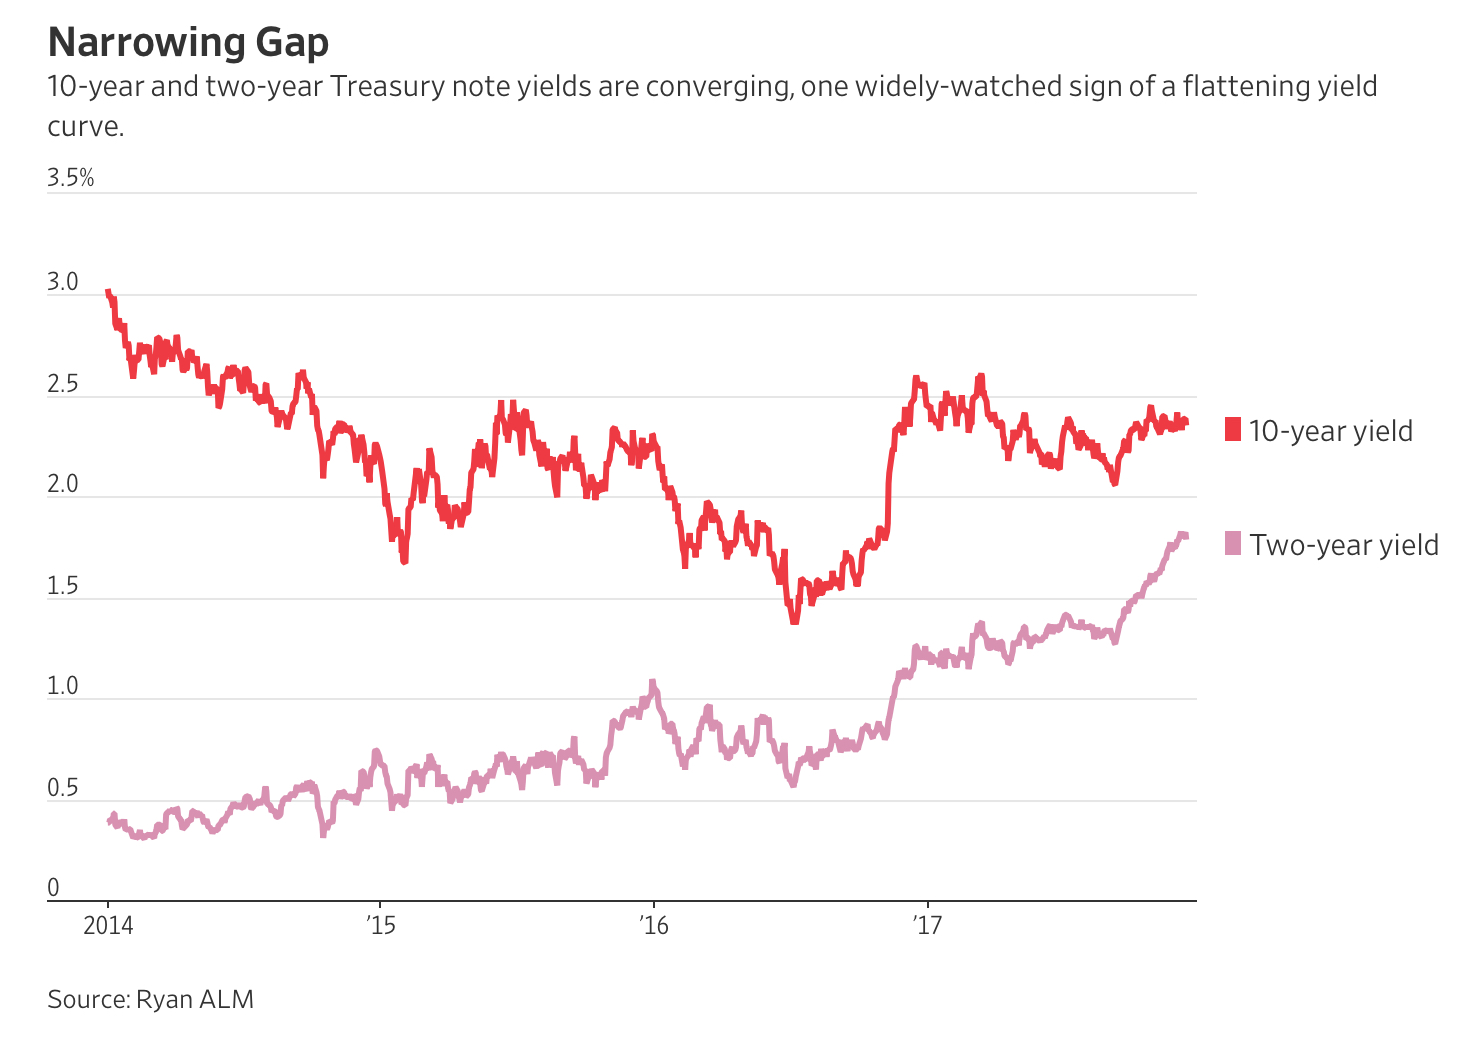
Ben Eisen, WSJ, on the yield curve…
Here Ben Eisen at the Wall Street Journal on the flattening yield curve: ”Long-term yields tend to go up and down alongside expectations for