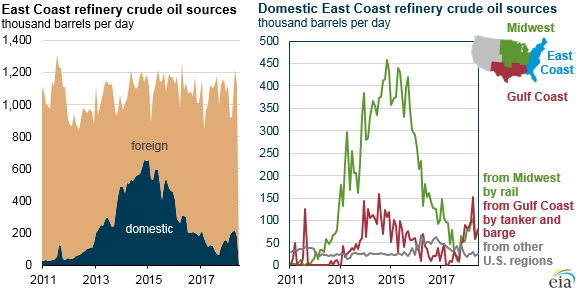
From the EIA’s Today in Energy, here... “Since mid-2017, the East Coast has been receiving as much crude oil by tanker and barge from the Gulf

WTI put spreads?
What looked like a large volume put spread traded yesterday in WTI options... Around 18,000 November 66/65 puts traded yesterday... Note the change
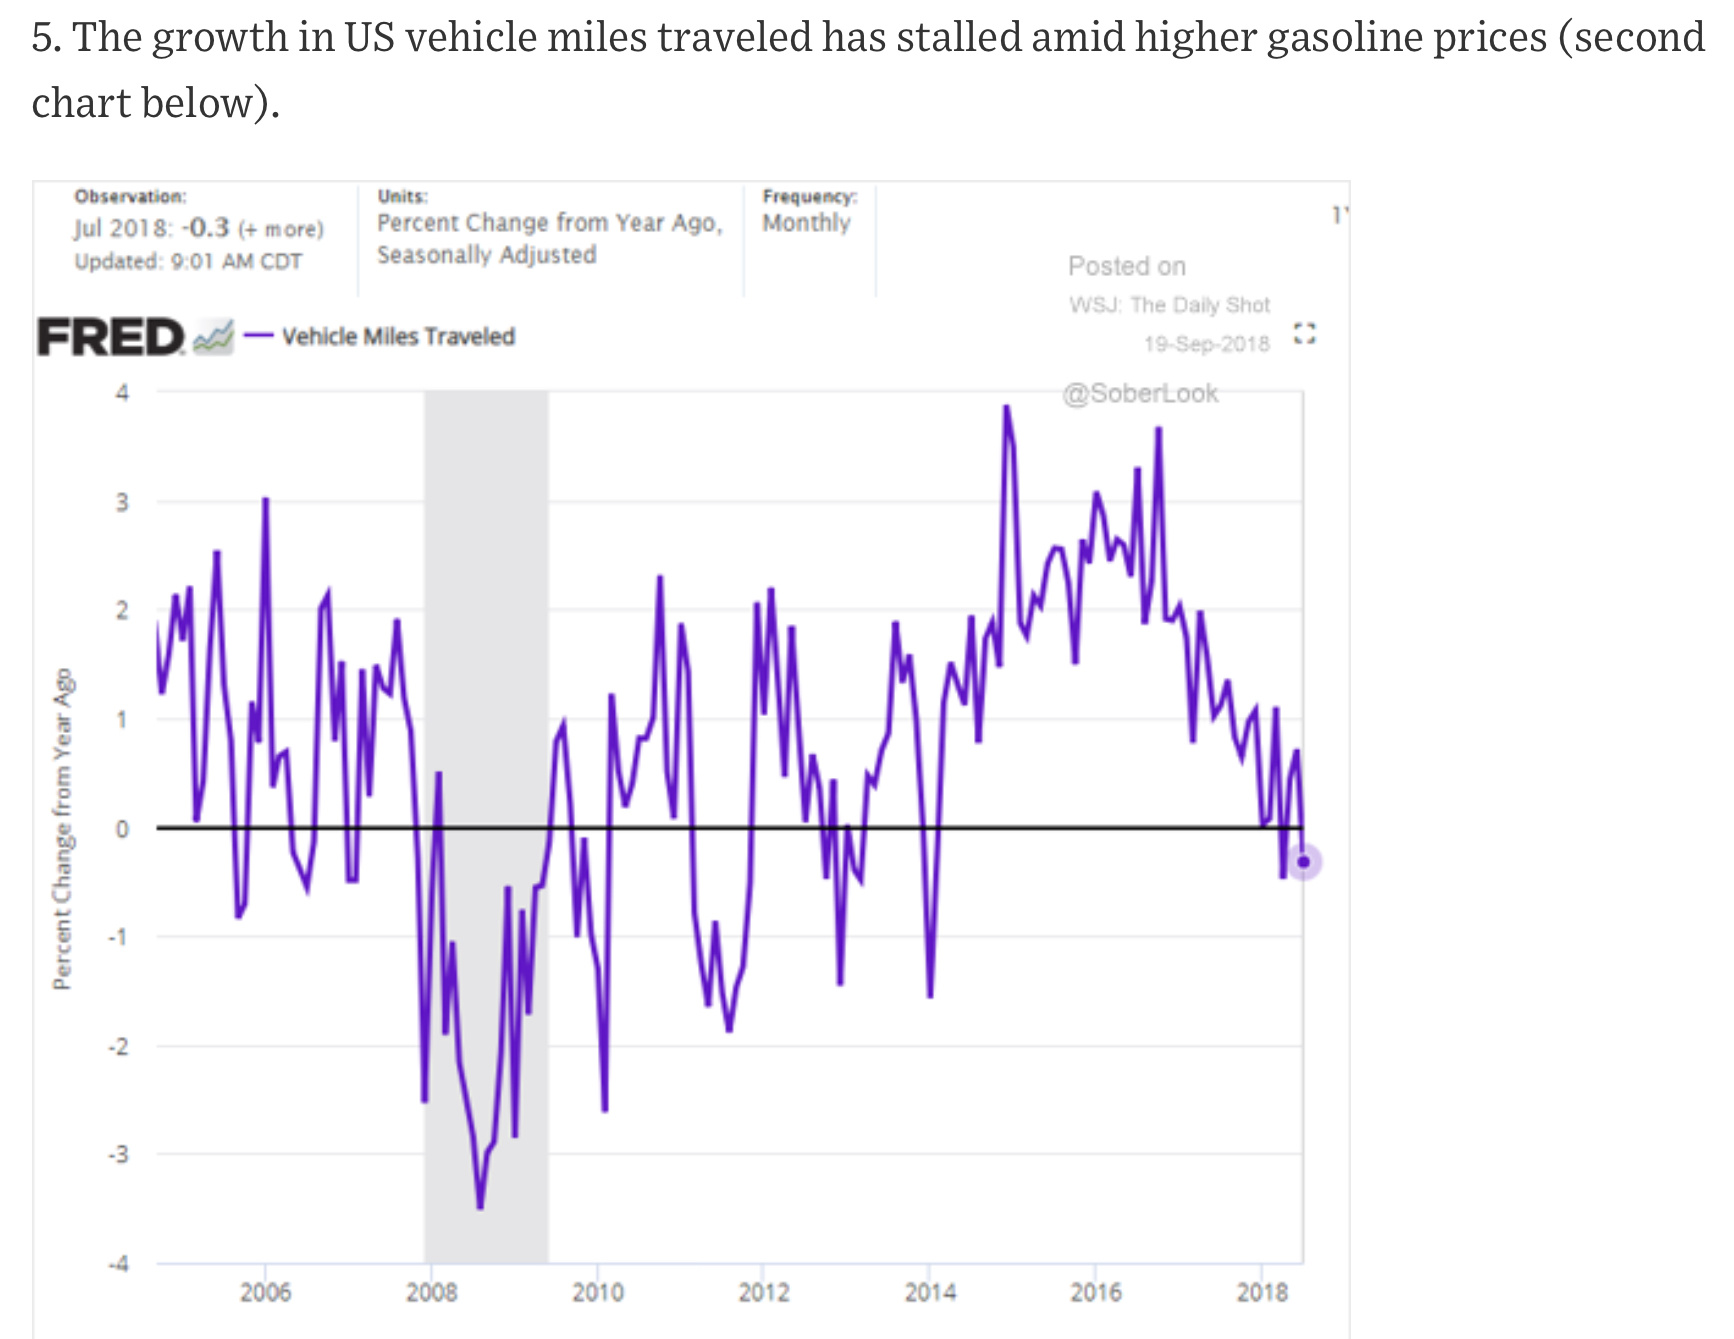
Chart book… The Daily Shot
It’s always worthwhile to take a look at the Wall Street Journal’s “The Daily Shot” here... And, here are two of many interesting charts: This
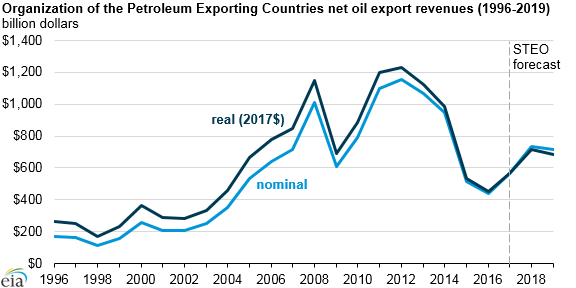
OPEC net oil revenues… EIA
The EIA’s Today in Energy has some nice charts showing OPEC revenues here:
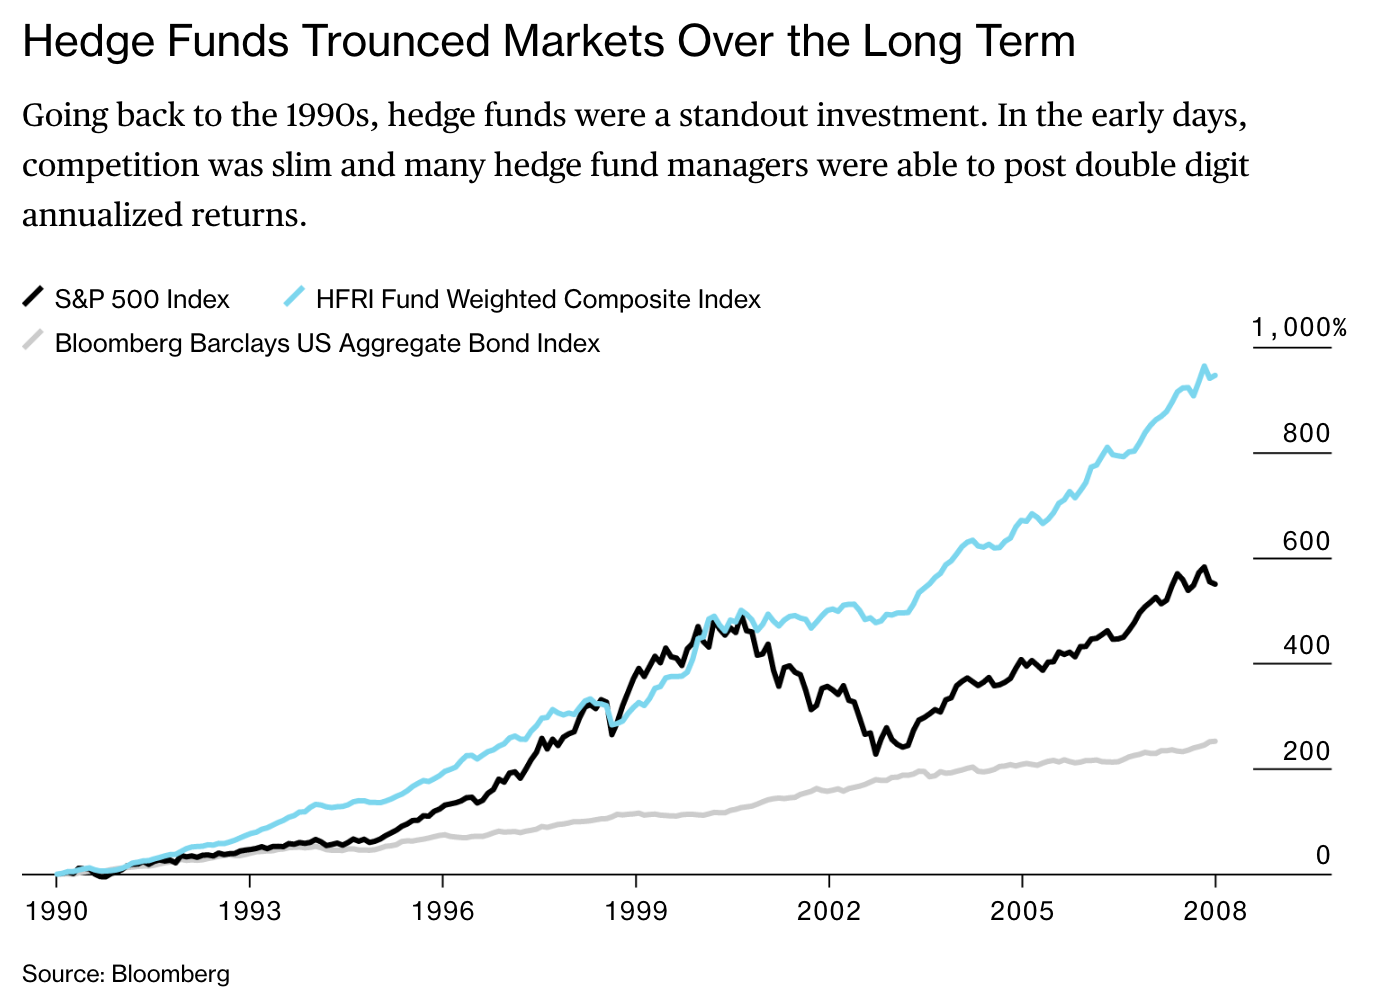
Hedge Fund Performance… Ritholtz
Barry Ritholz, Bloomberg, suggests some reasons why hedge funds have underperformed the S&P, here and here... His charts tell the tale:
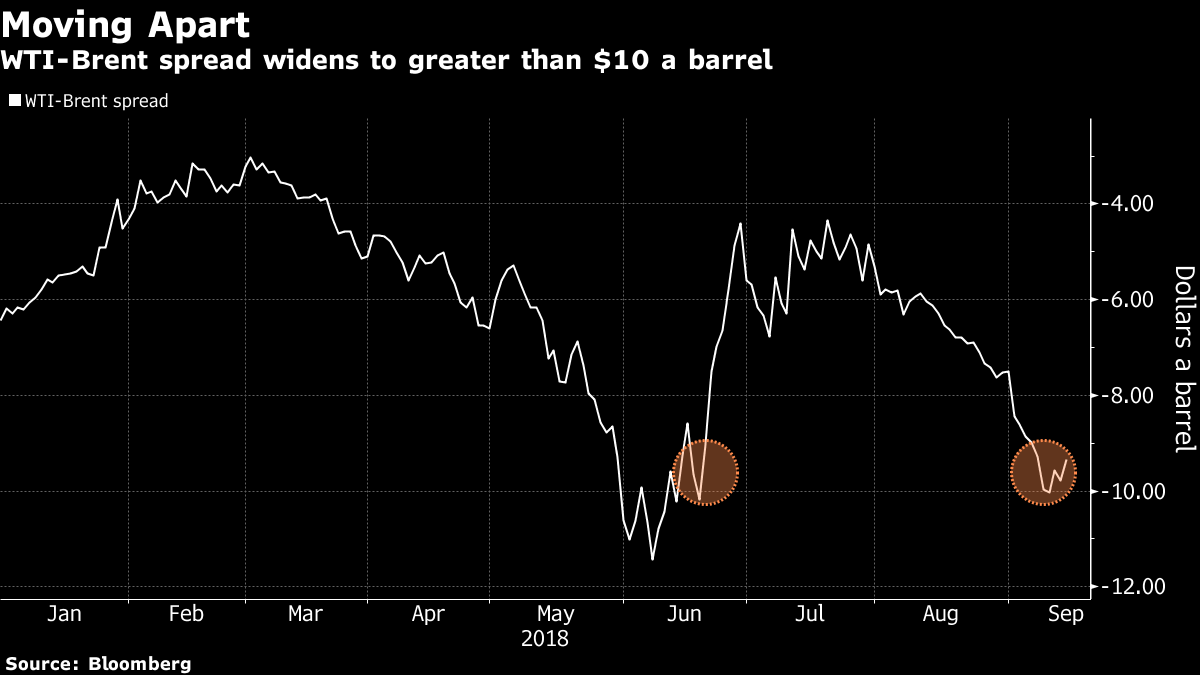
Tale of Two Oil Markets (revisited)… Bloomberg
Here is Jessica Summers, Blooomberg, on the divergence of Brent and WTI oil prices: “Hedge funds’ net-long position -- the difference between bets

India buys less oil from Iran… Reuters
Market participants are trying to figure out how much Iranian oil will be sold after November... Here is Nidhi Verma, Reuters on Indian
100 million Euro loss in Nordic power market.. FT
Phil Stafford and David Sheppard, Financial Times, write, here: (my bold) “The catalyst for the trading loss was a series of backfiring bets on
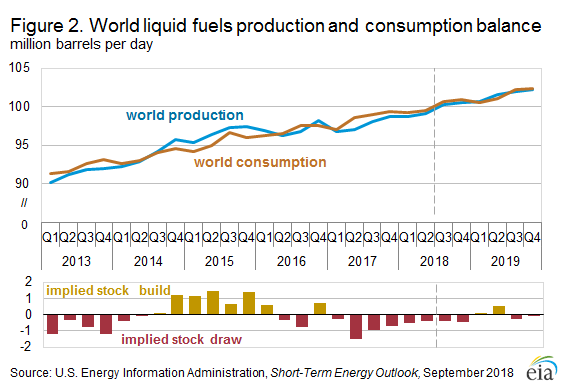
Petroleum Supply/Demand Balance.. EIA
Here is the EIA’s take on petroleum supply/demand going forward: