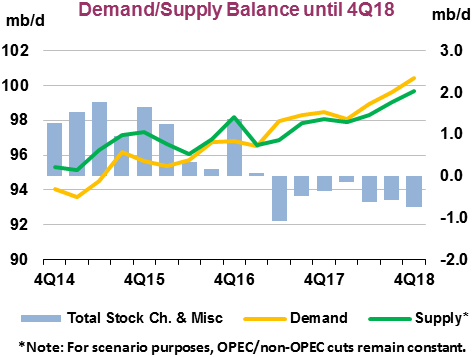
Two charts from the monthly oil market reports of the International Energy Agency and the Energy Information Agency show how they differ significantly… The first chart is from the IEA, showing world demand outstripping supply for the balance of 2018:
The EIA, however, shows stock builds for the balance of the year…

Leave a Reply