The EIA’s always excellent “This Week In Petroleum” includes a very interesting chart showing hedging contributions to revenue for oil producers, here… The chart shows only net gains or zero, I’m not sure where hedging losses show up in the chart…
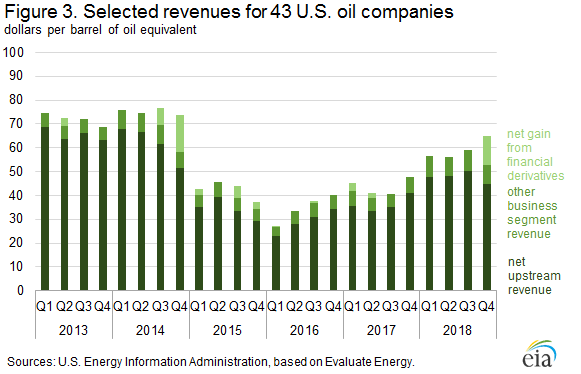
“Contributions to revenue from derivative hedges—which increase in value when prices decline— for these 43 companies reached the largest total for any quarter since the fourth quarter of 2014 (Figure 3). During the entire 2013–18 period, financial hedging was a source of revenue less than half of the time, whereas in other quarters it is listed as a net loss from derivatives and appears in Figure 2 above.”
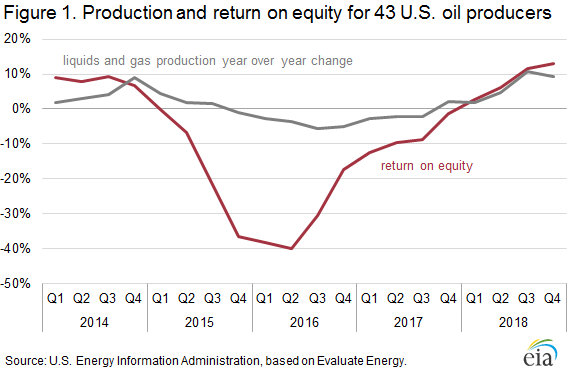
And, from the same article:
Leave a Reply