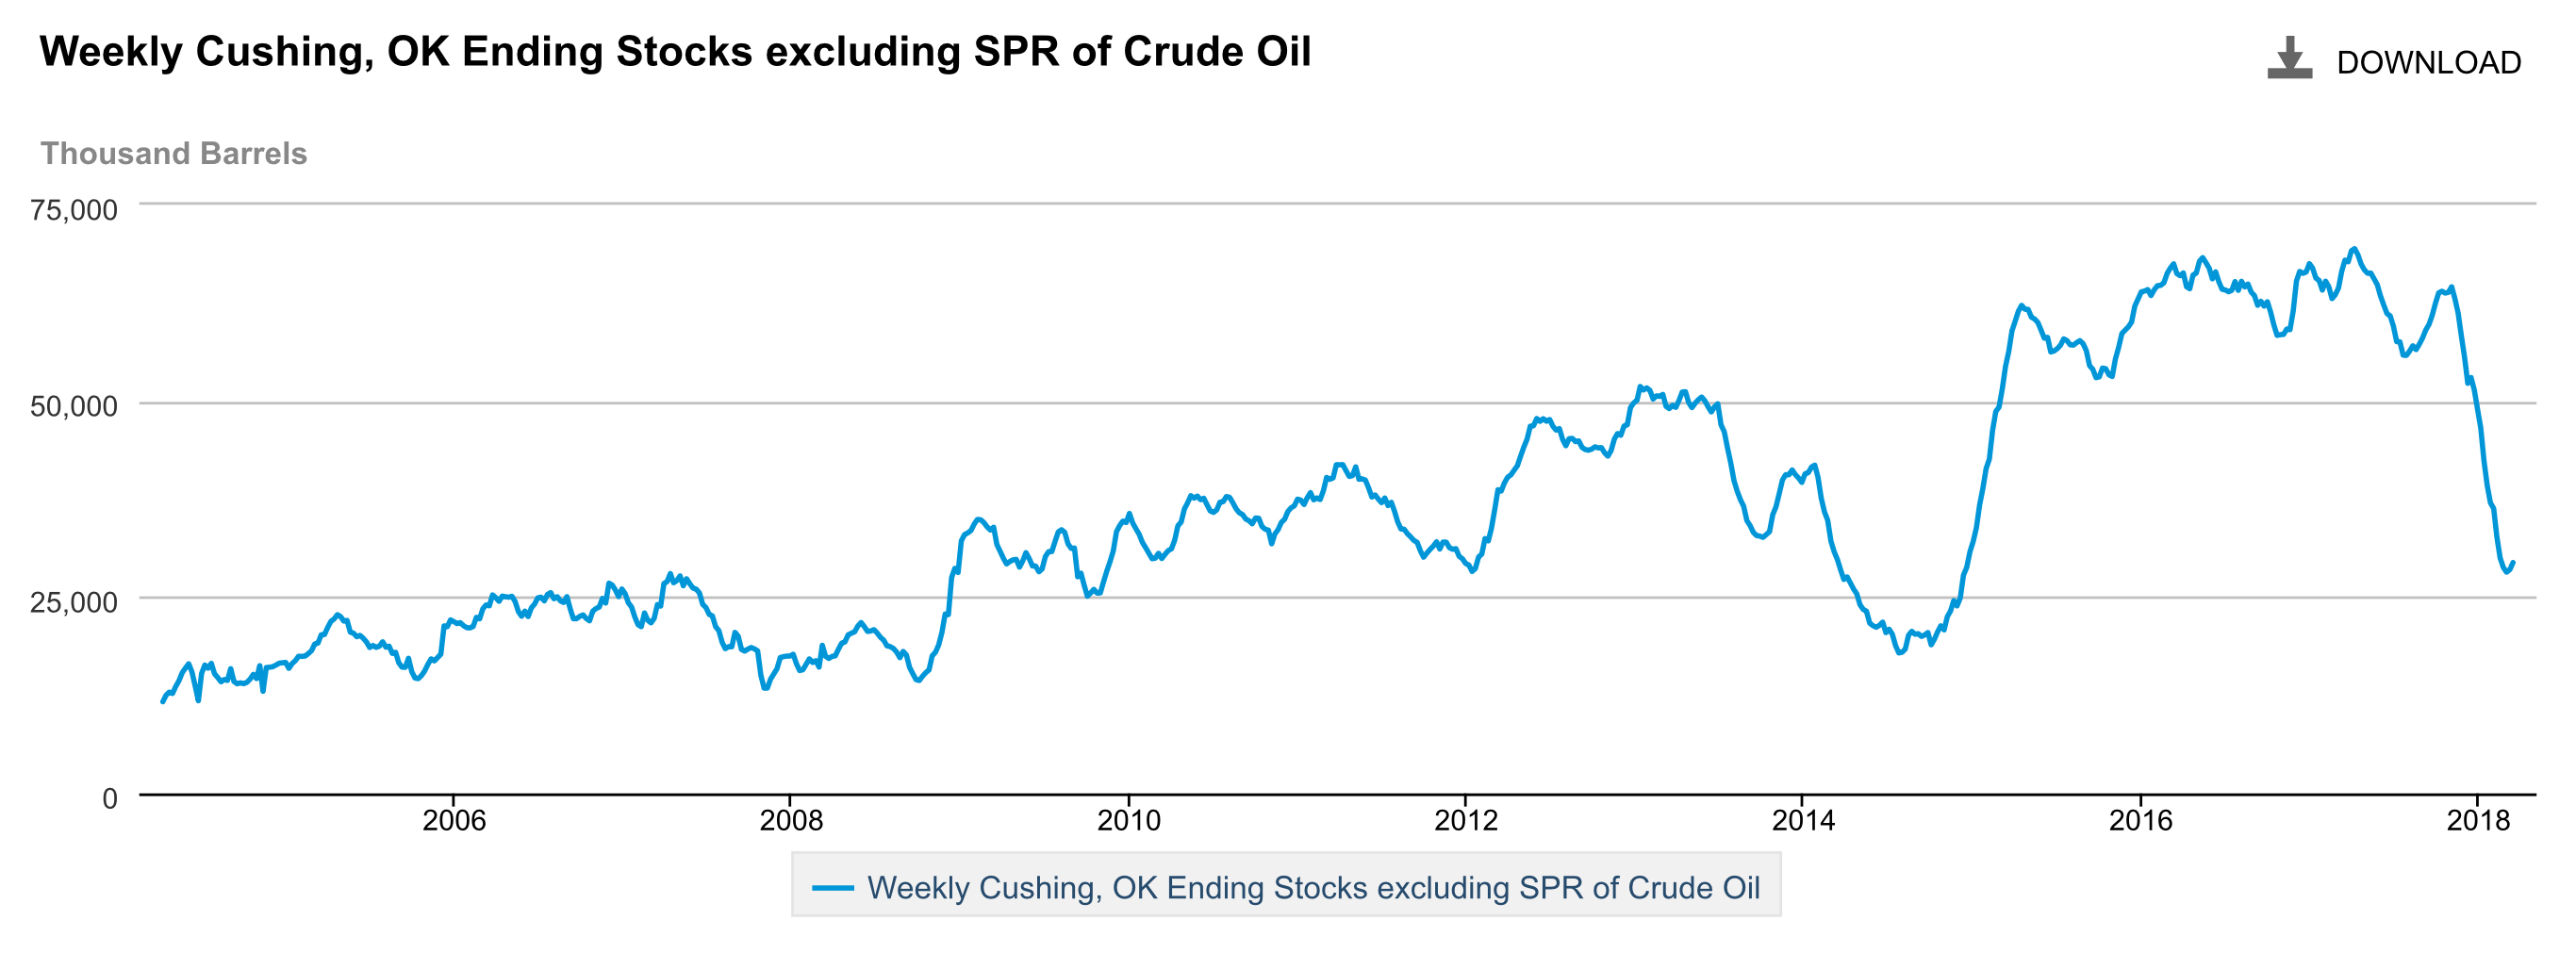
If you knew Cushing would draw over the past quarter like this:
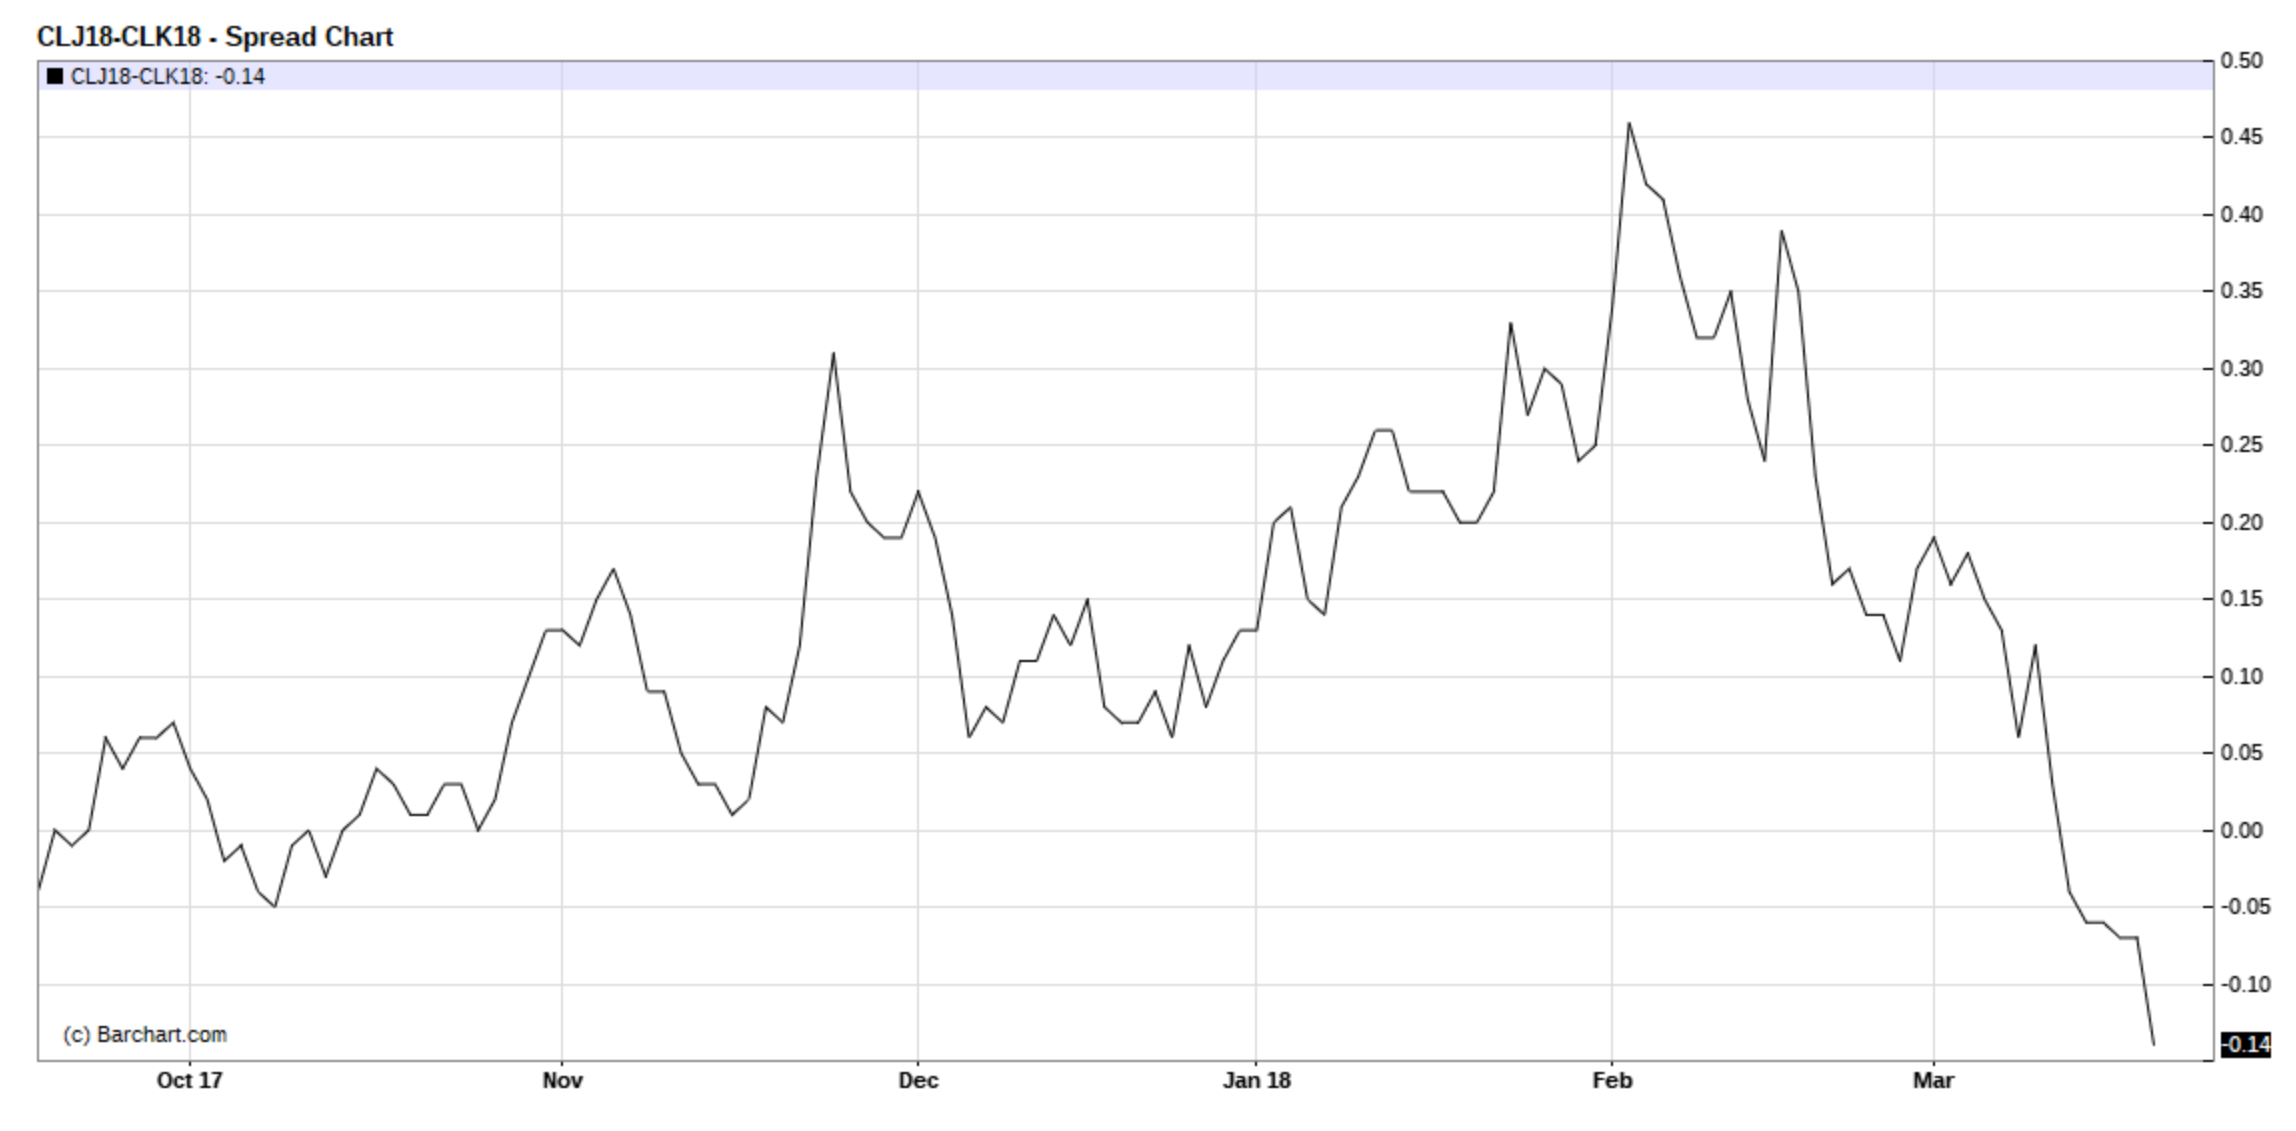
Would you expect April/May WTI to go out like this?:
The top chart is from here: https://www.eia.gov/dnav/pet/hist/LeafHandler.ashx?n=PET&s=W_EPC0_SAX_YCUOK_MBBL&f=W
The bottom chart: https://www.barchart.com/futures/quotes/CLJ18/technical-chart?plot=LINE&volume=contract&data=DO&density=M&pricesOn=1&asPctChange=0&logscale=0&sym=CLJ18-CLK18&grid=1&height=500&studyheight=100&isSpread=1
Leave a Reply