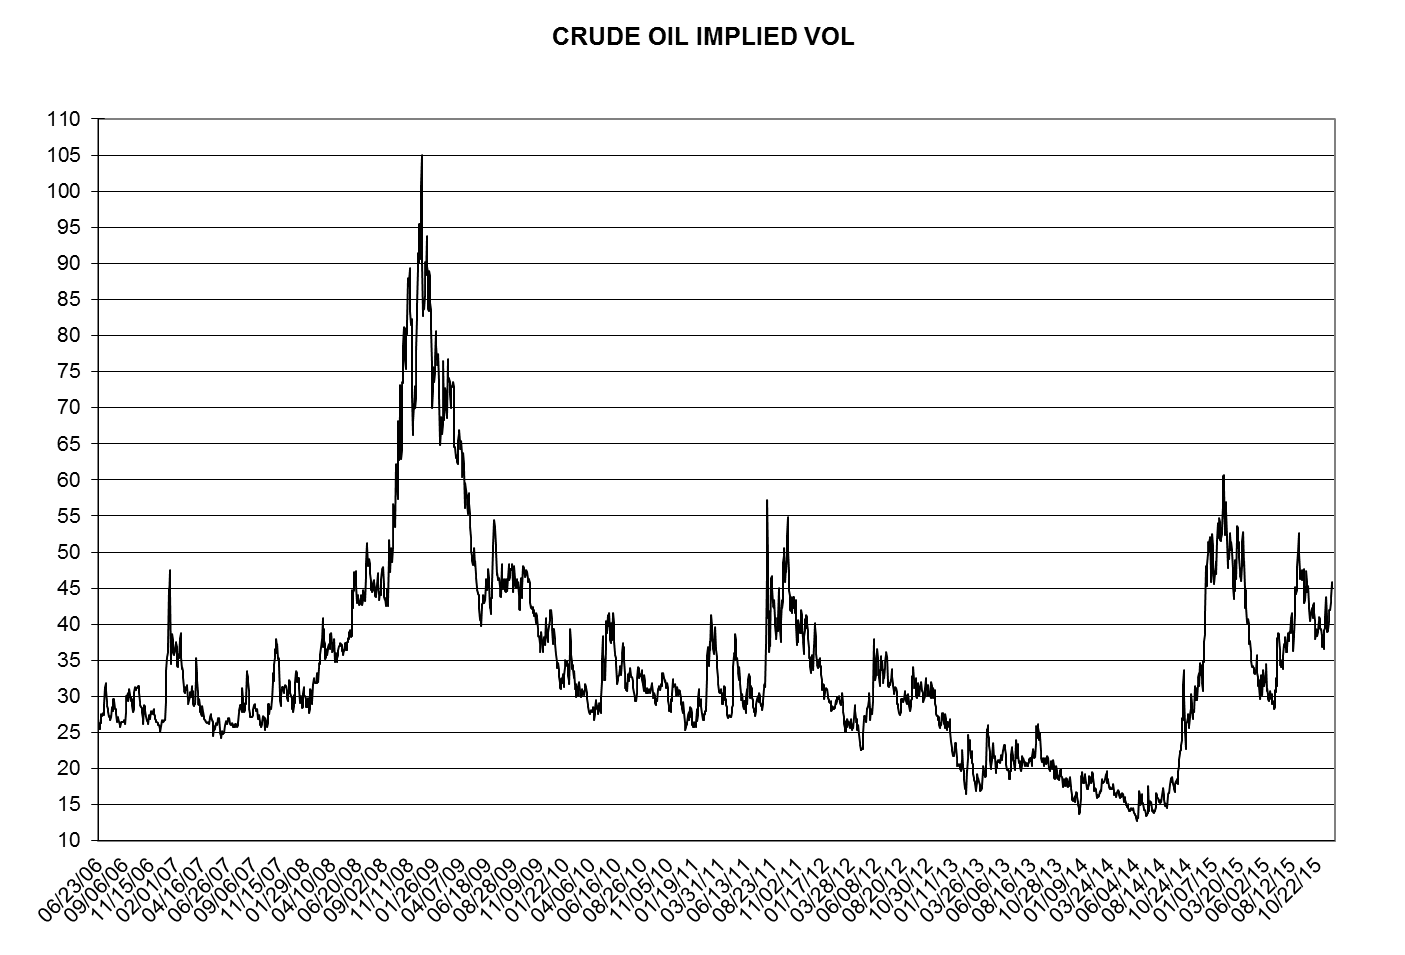
The chart shows below implied vol for crude oil options going back to June of 2006 through Thursday, December 3rd, 2015, based on the second nearby at the money option. Implied vols have increased as the OPEC meeting neared, from 36.6 on November 10th to 45.8 on Wednesday. We will update this chart next week to show implied vol post-OPEC meeting. This 10+ year chart shows an area of record low implied vol during the spring and summer of 2014, but record highs of over 120 were made during January of 1991 just before bombs were dropped in Iraq…
Leave a Reply