Nathaniel Bullard, Bloomberg, has a nice piece with his favorite 10 charts of the year...
The Democratic race so far… PredictIt
Here is a current chart of Democratic candidates from the betting market, PredictIt:
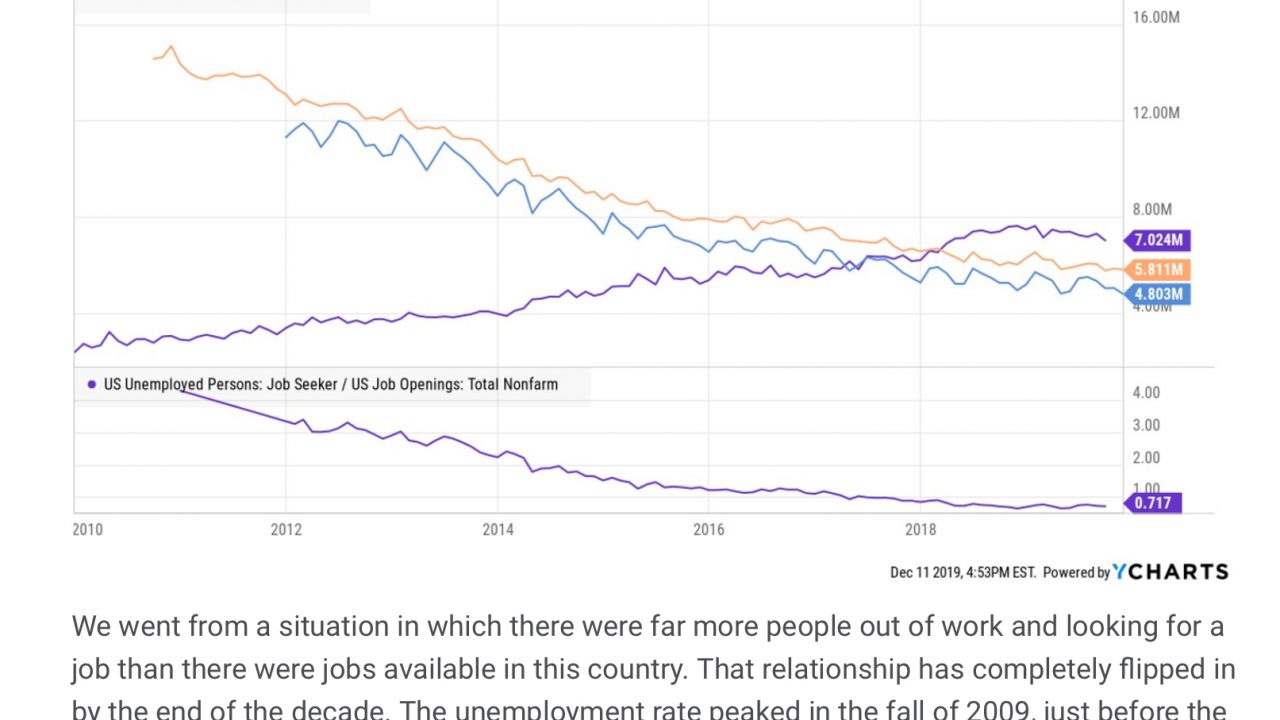
Best chart of the decade? A Wealth of Common Sense
Ben Carlson, A Wealth of Common Sense, likes this one:
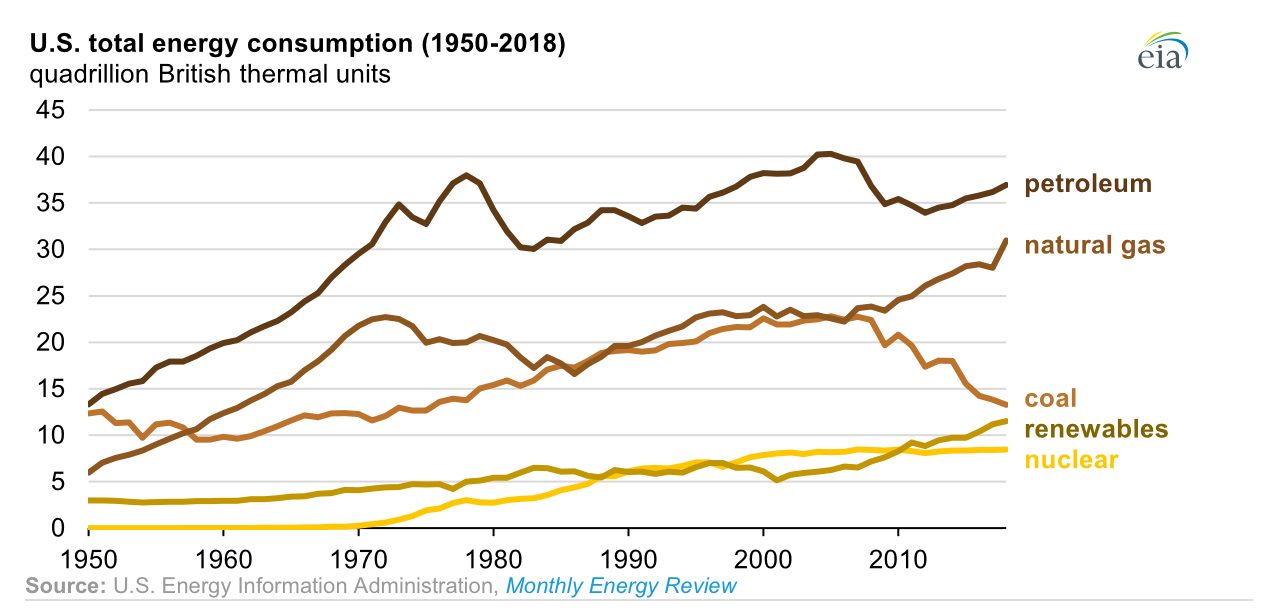
US energy consumption… EIA
The EIA put out some nice charts on US energy consumption trends, here...
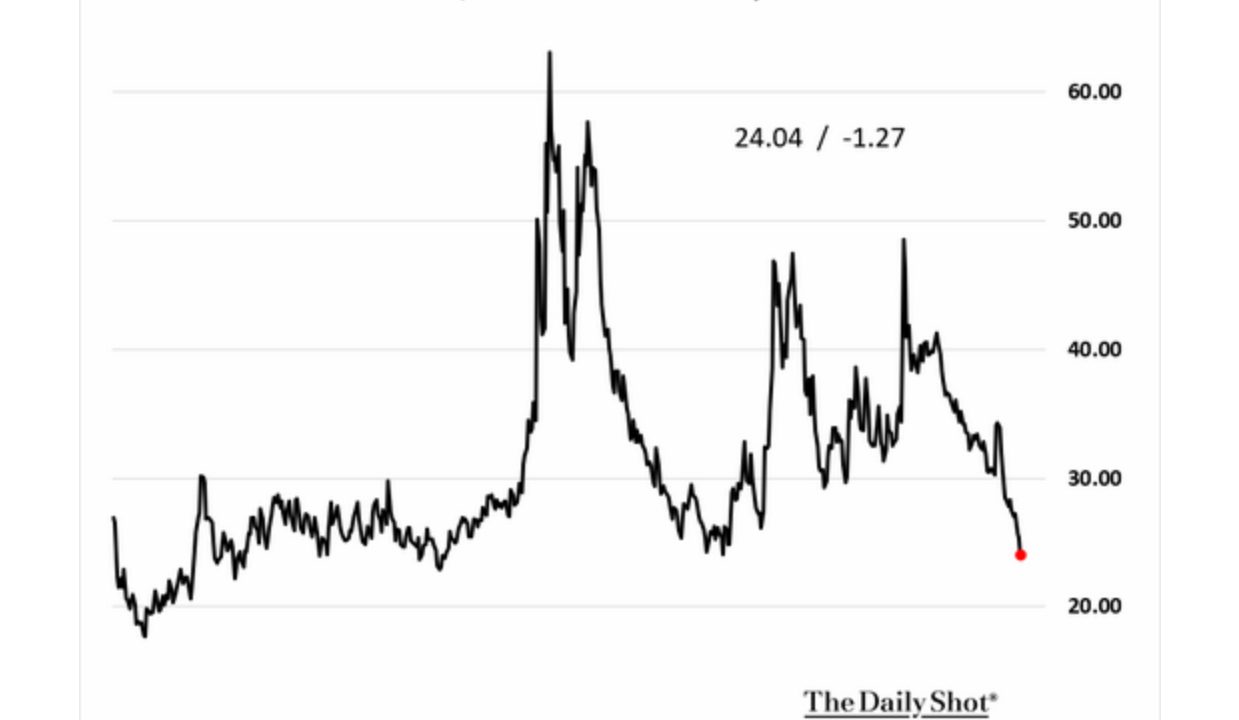
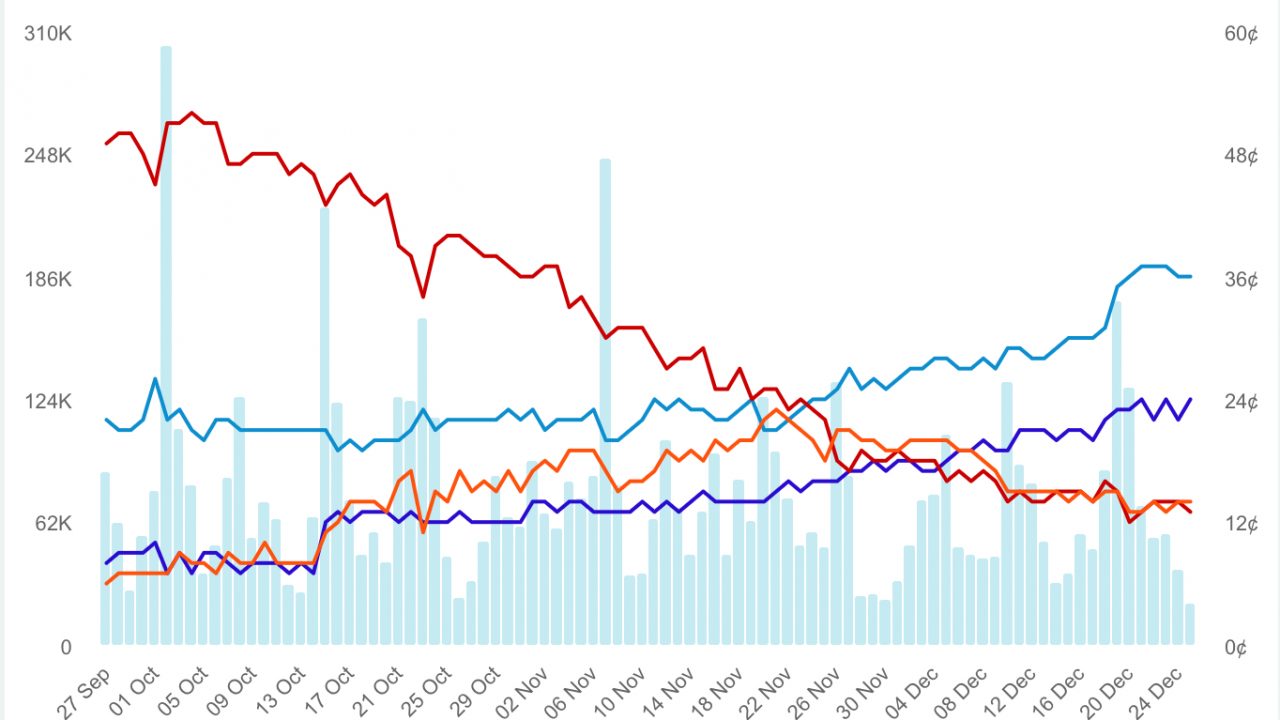
Oil VIX plummets… WSJ
Here is a chart showing the CBOE’s oil VIX from the Wall Street Journal:
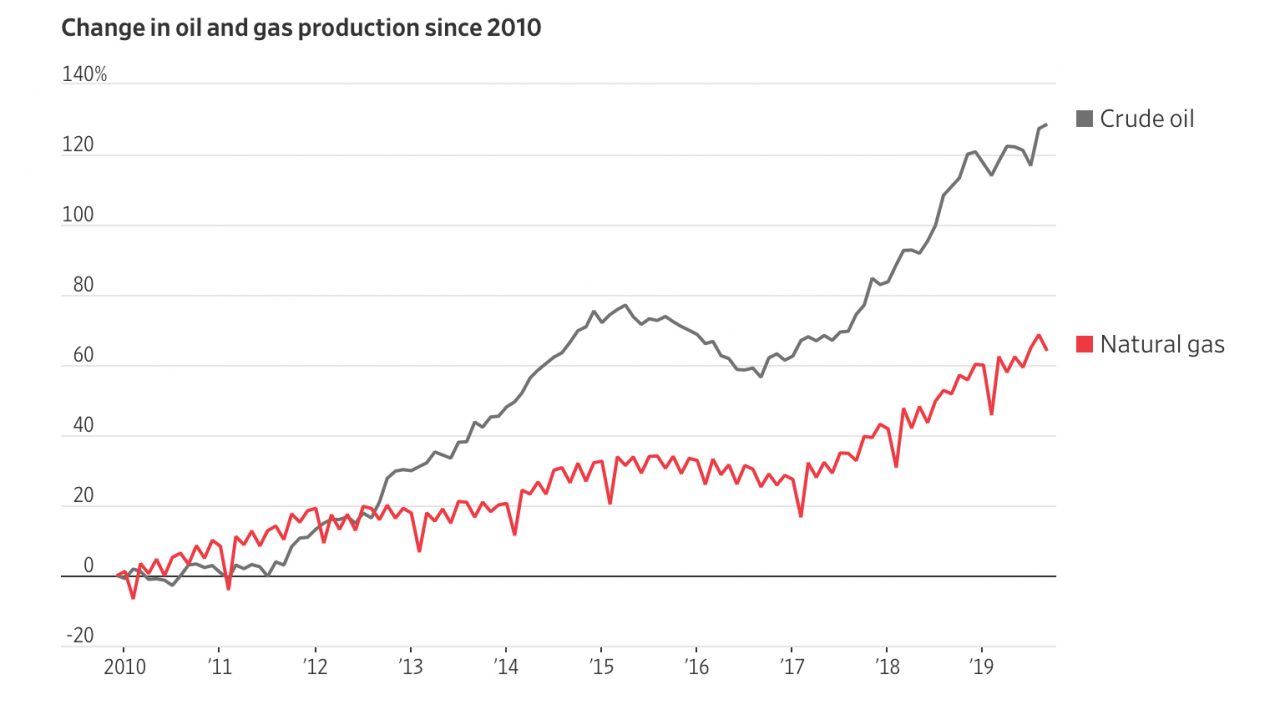
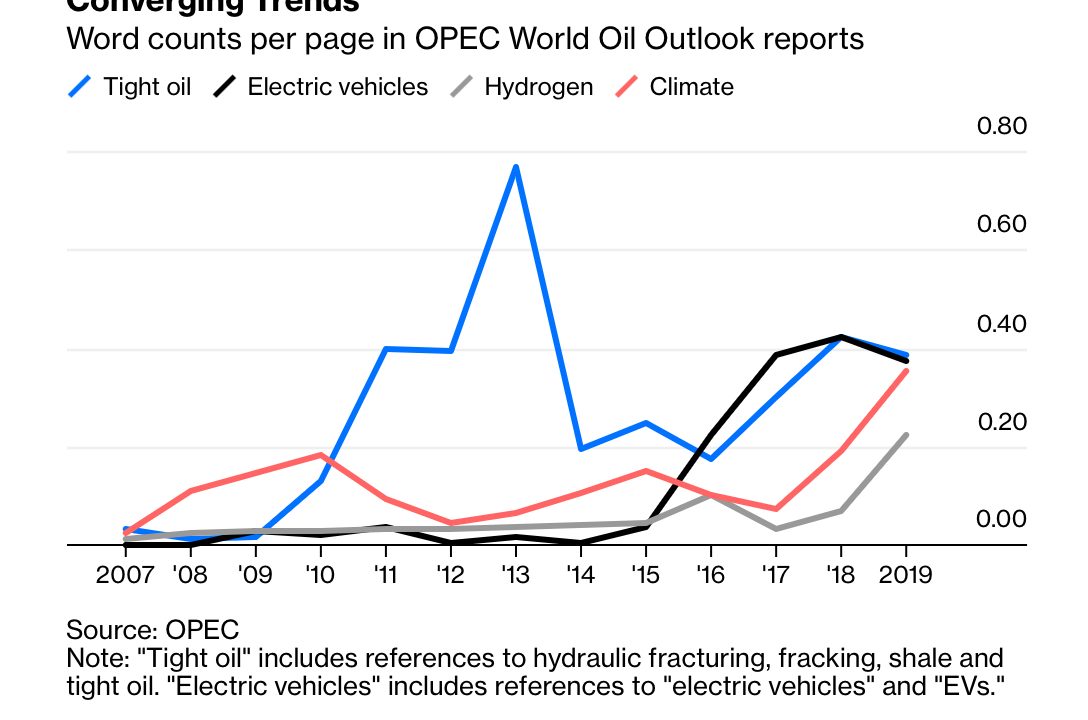
The decade in fracking… WSJ
Rebecca Elliott and Luis Santiago, Wall Street Journal, do a great job summarizing a decade of fracking, here...
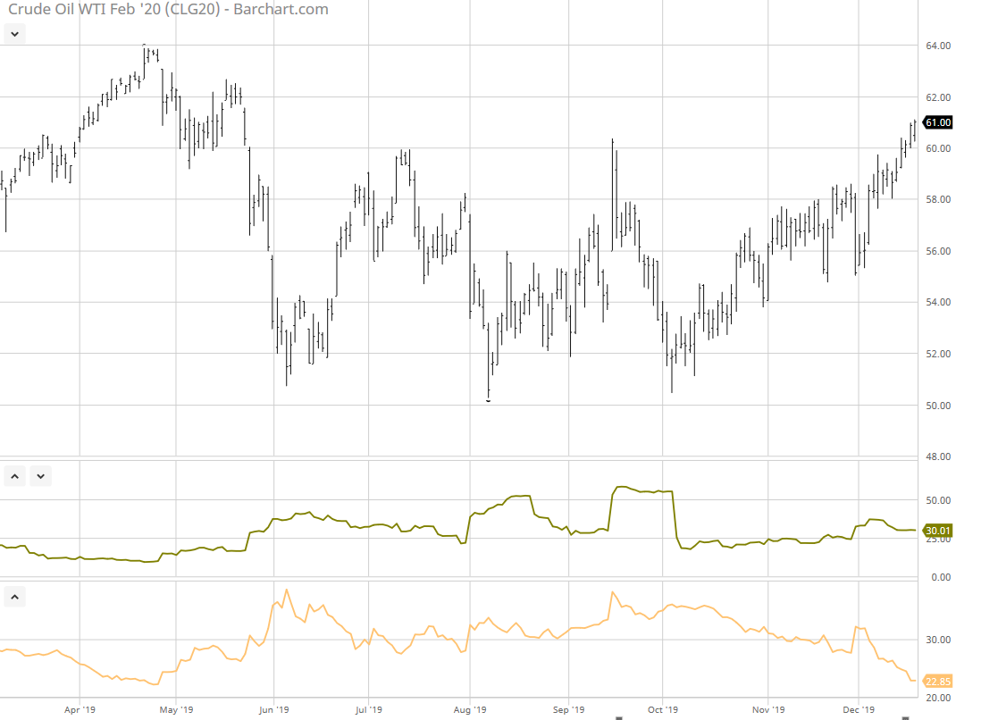
Historical/implied vol divergence, WTI…
Implied and historical (realized) volatility have diverged recently... Higher prices due to expected fewer OPEC barrels, perhaps a better world
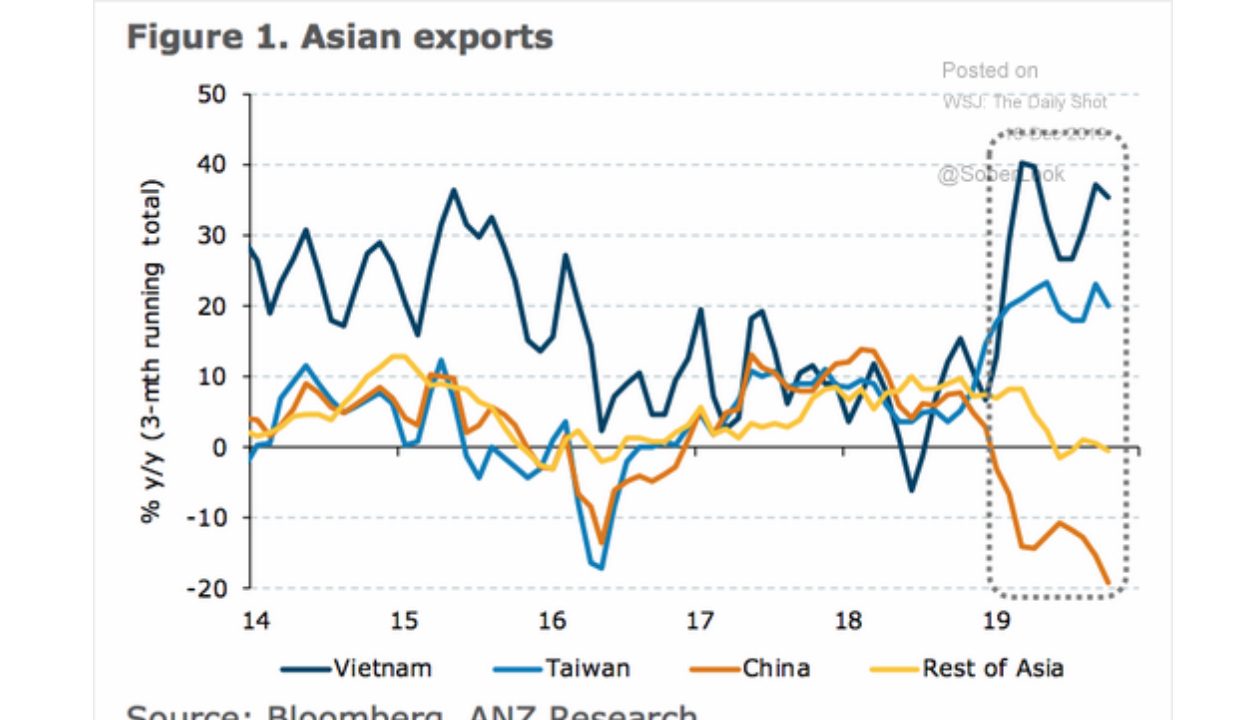
Asian Exports… The Daily Shot
No surprise here, from the Wall Street Journal’s The Daily Shot:
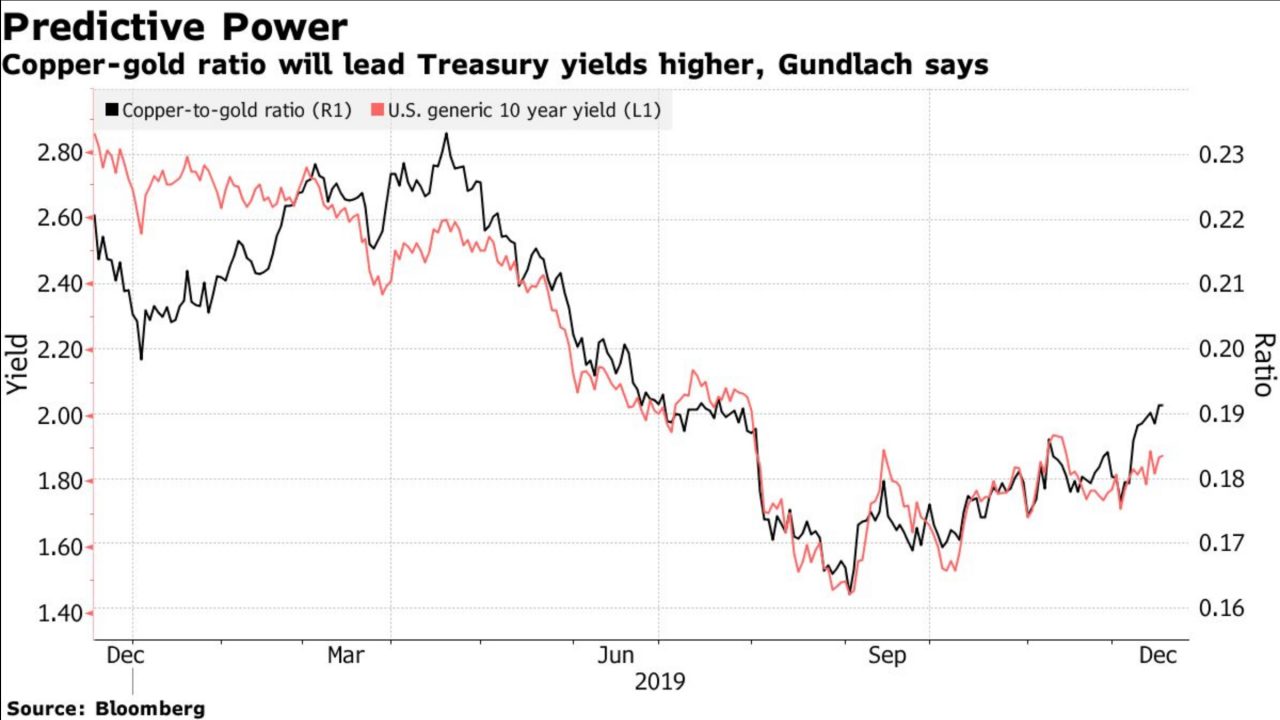
Copper/Gold ratio as a predictor of rates… Bloomberg
Katherine Greifeld, Bloomberg, quotes hedge fund manager Jeffery Gundlach, here.... “Rallying copper tends to indicate demand for home-building and