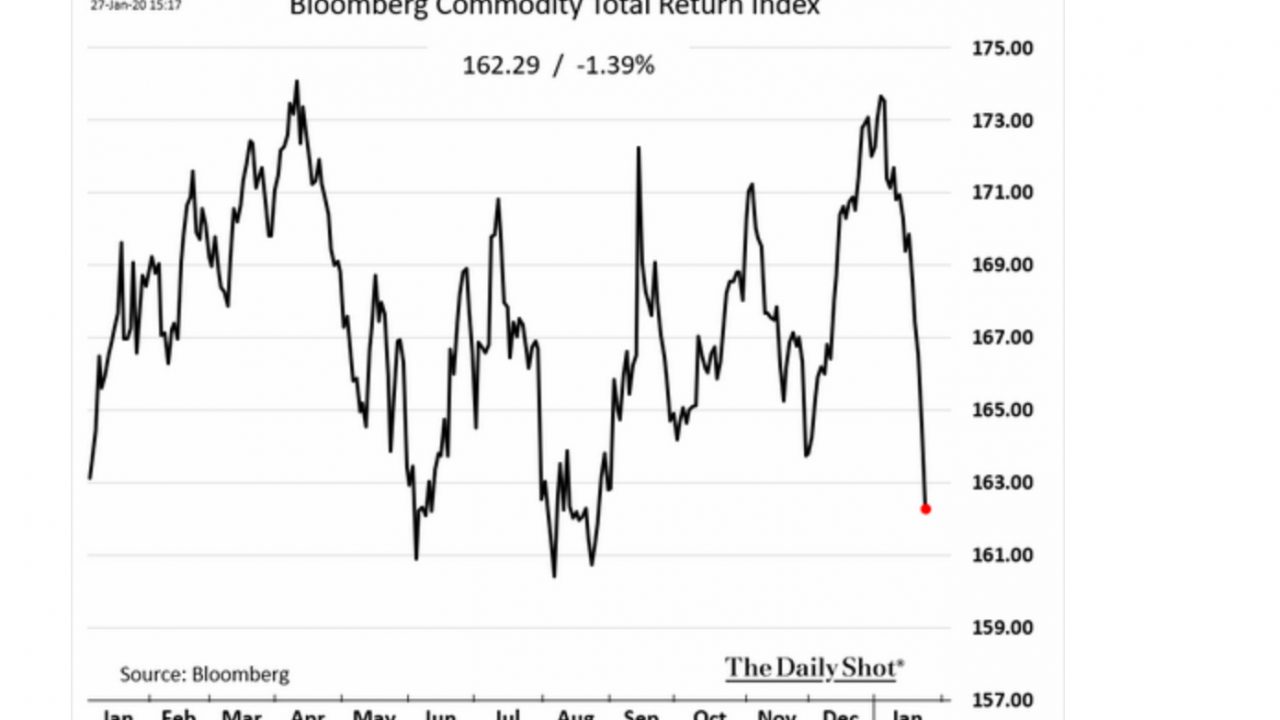
Here is a look at Goldman Sach’s Commodity Index (GSCI) from the Wall Street Journal’s The Daily Shot: Of course, we seem to attribute “bad” to

Oil traders made billions in 2019… Bloomberg
Lots of optionality contained within real assets give the oil majors an advantage as they aggressively trade around these... Javier Blas, Bloomberg
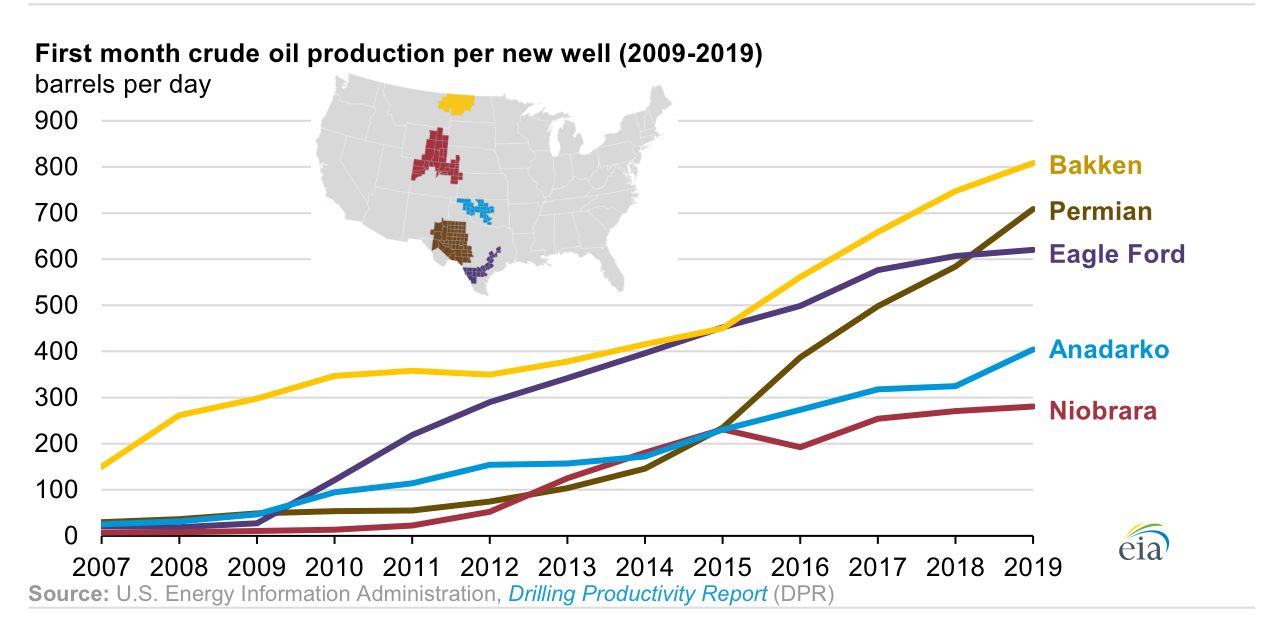
US crude oil production efficiency continues… EIA
Still increasing productivity after all these years! Here is the EIA’s “Today in Energy”: ”The average new well in each DPR region produced more
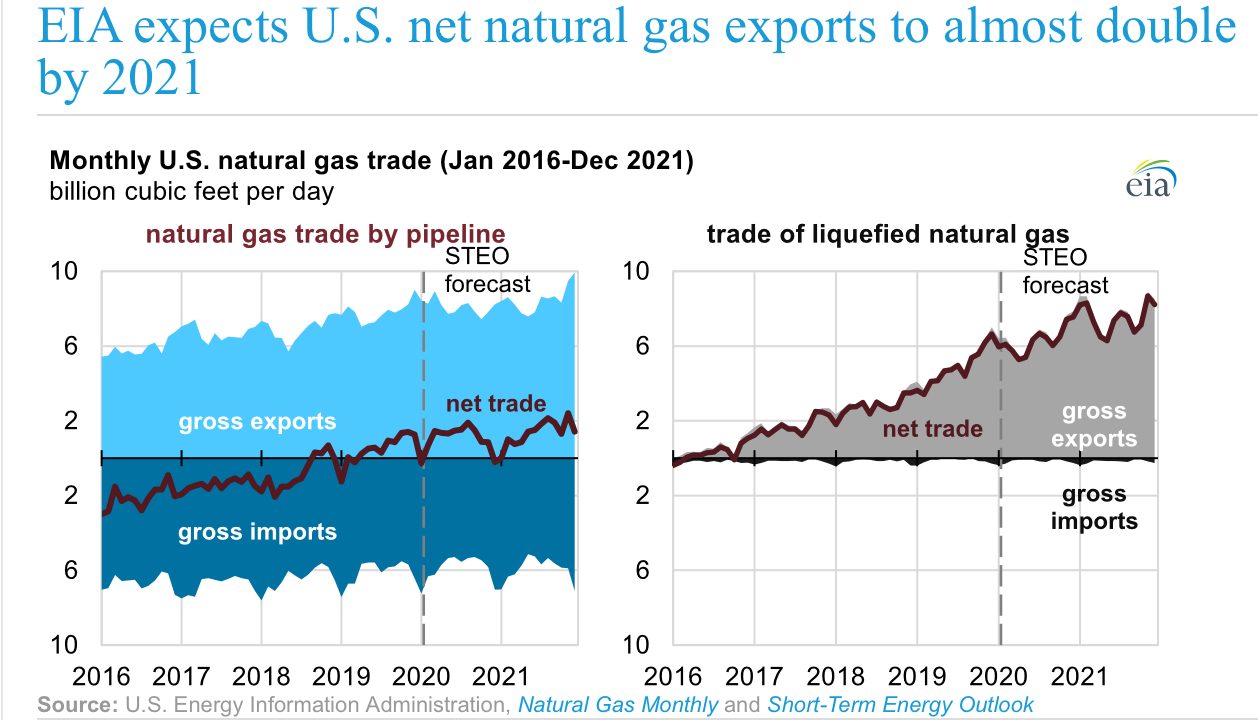
EIA expects net natural gas exports to double by 2021… EIA
From the EIA’s Today in Energy, here: ”...the U.S. Energy Information Administration (EIA) forecasts that U.S. natural gas exports will exceed
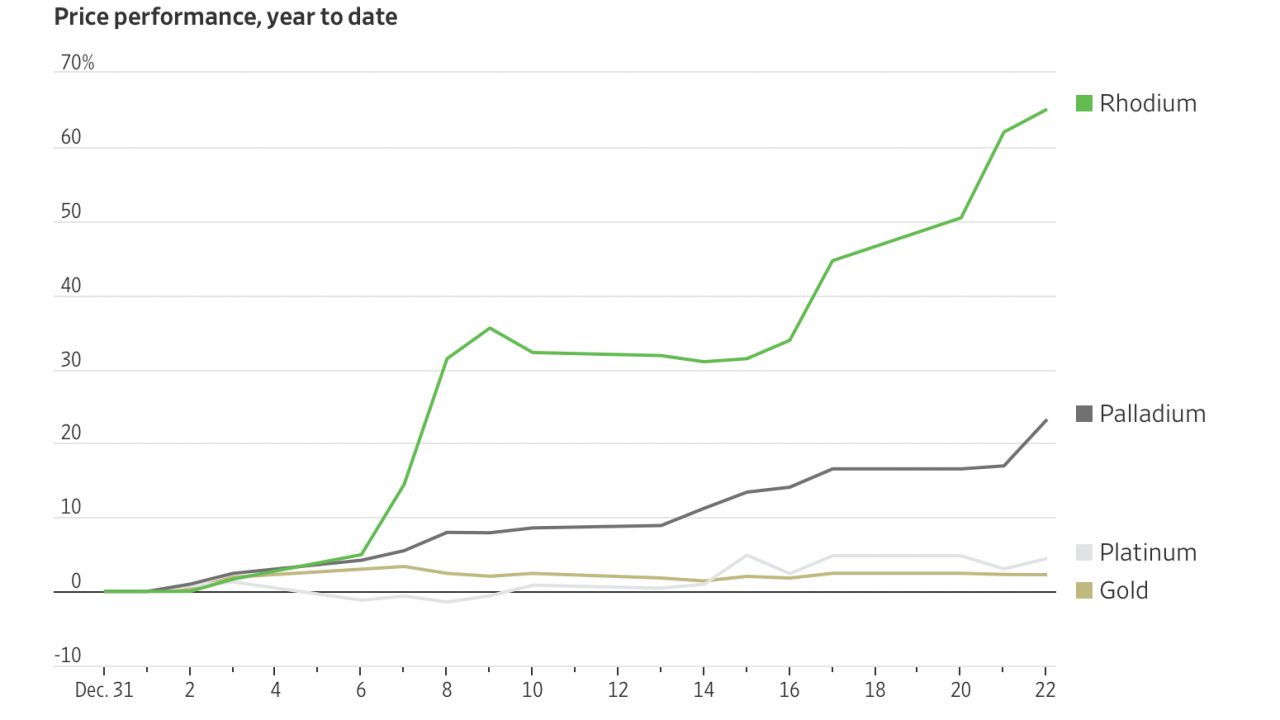
Rhodium prices surge… WSJ
Joe Wallace, Wall Street Journal, has a nice piece on rhodium, here... “The price of rhodium, a precious metal that strips pollutants out of
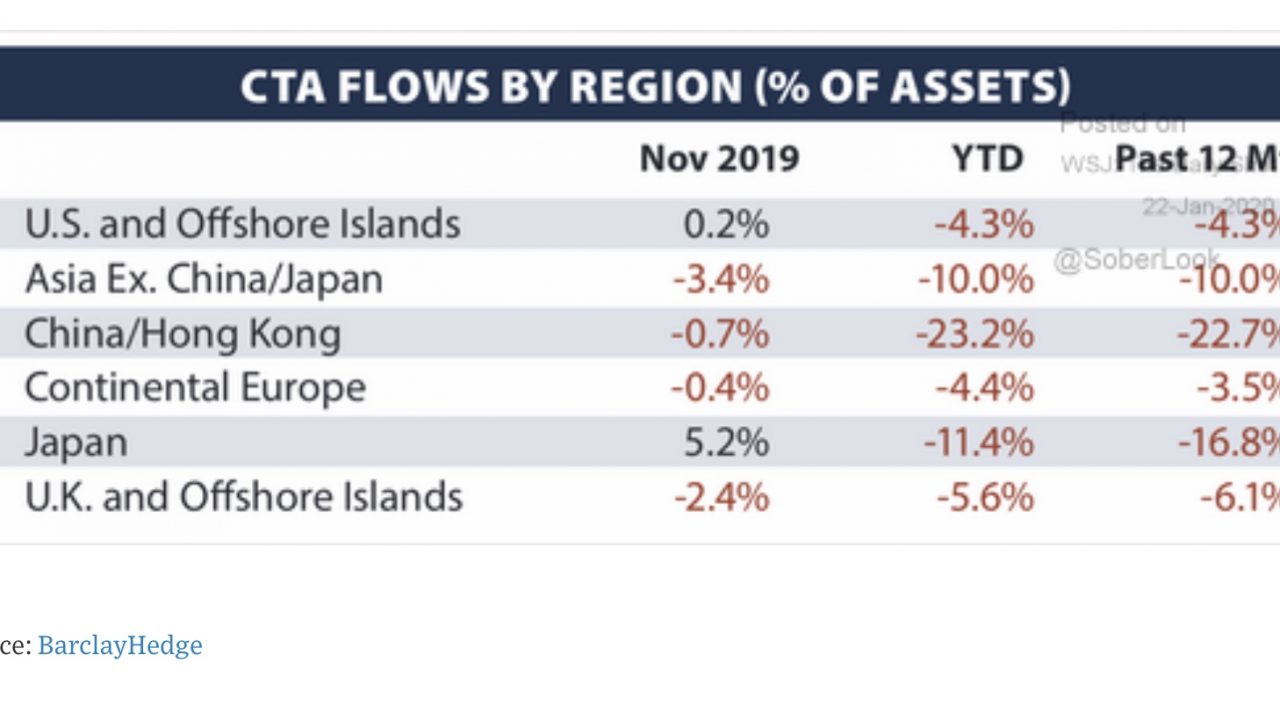
Hedge fund money flows… BarclayHedge via WSJ
Money moved out of hedge funds in 2019... Here are some graphics from BarclayHedge via The Wall Street Journal:
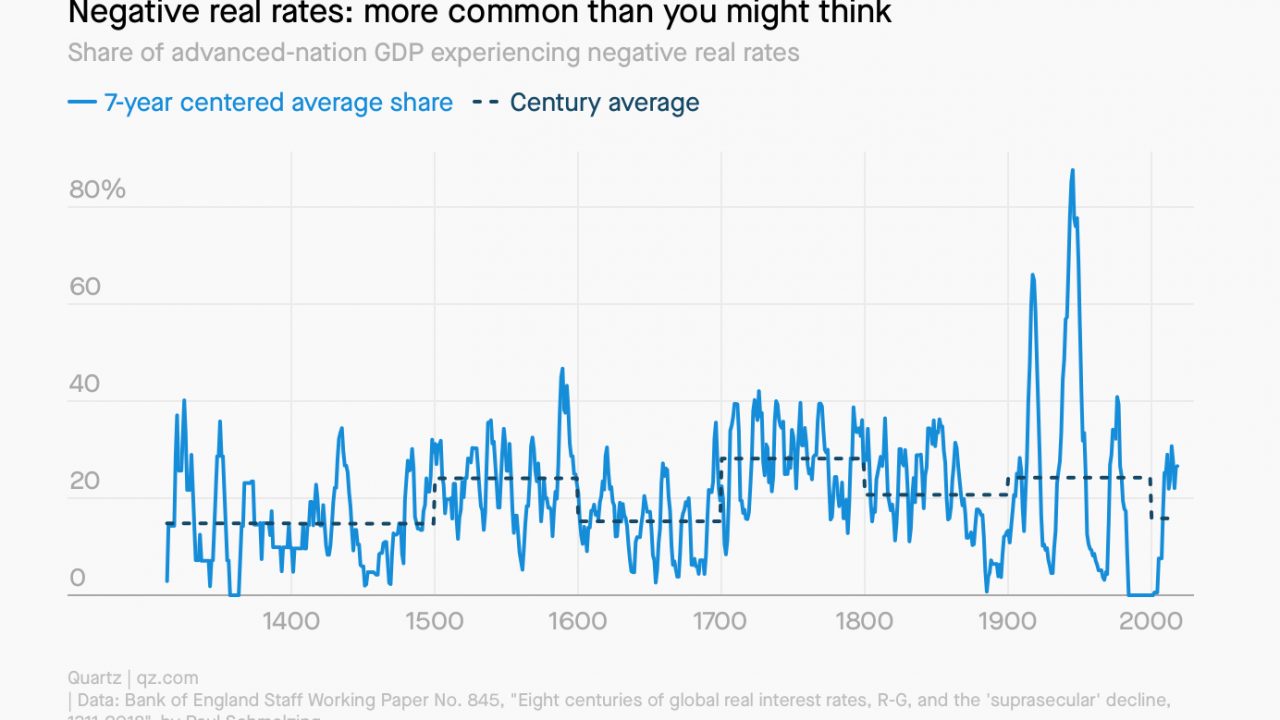
700 years of interest rates… Quartz
And I think my chart of implied vol for oil going back to 1986 is long term... Here is a chart from Quartz:
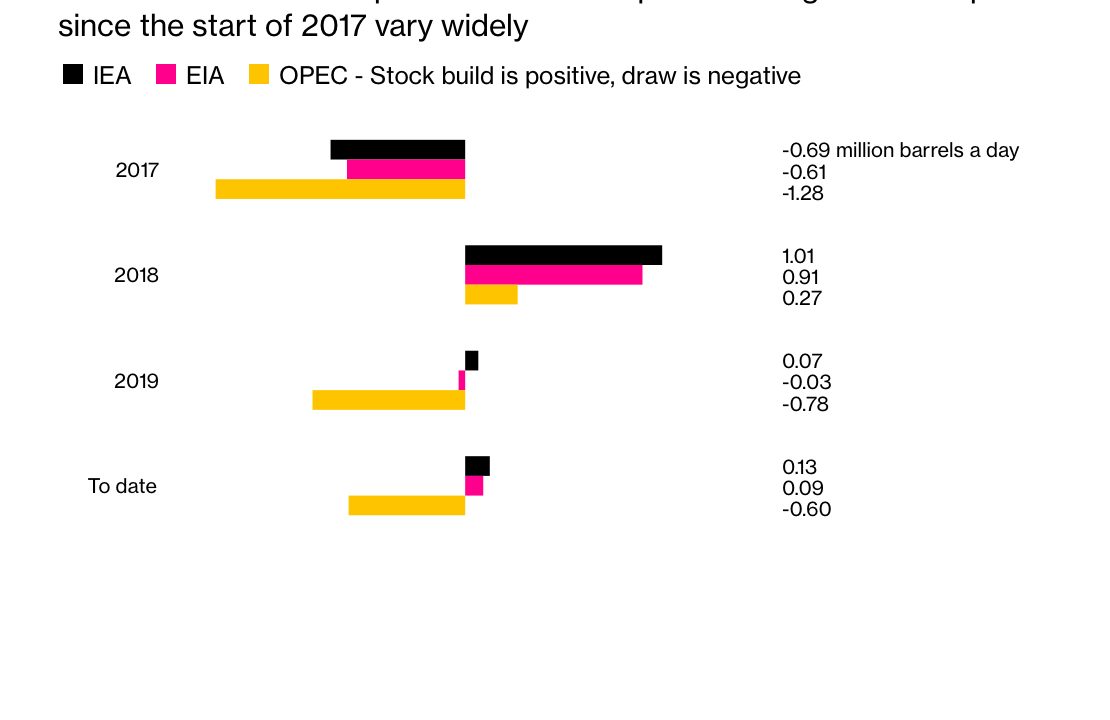
Comparing supply/demand estimates for oil… Bloomberg
Julian Lee looks at the big three (OPEC, IEA, EIA) monthly oil reports, here... “OPEC’s latest forecast shows global oil inventories falling at an
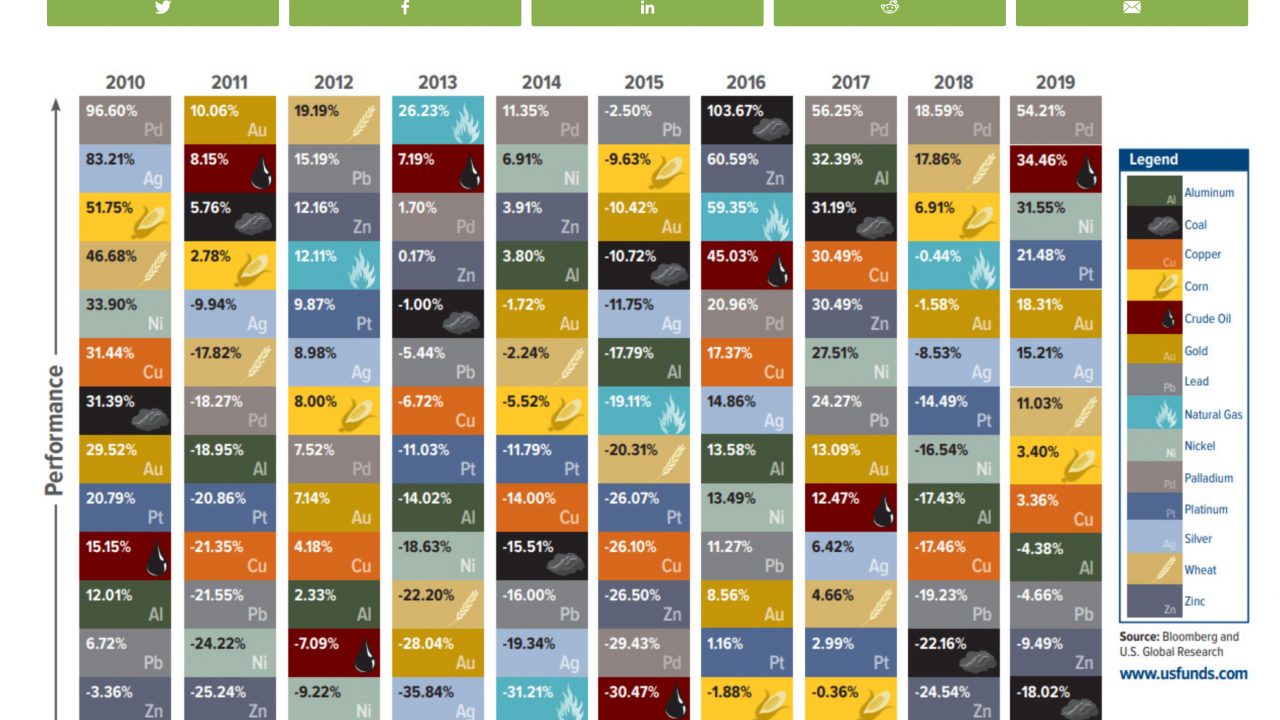
Periodic table of commodity returns… Visual Capitalist
I look forward to this chart every year, from The Visual Capitalist, here..