The second most active strike yesterday was a May/June -$4.00 put! 7,500 of theses traded, increasing open interest by the same amount... (settled at
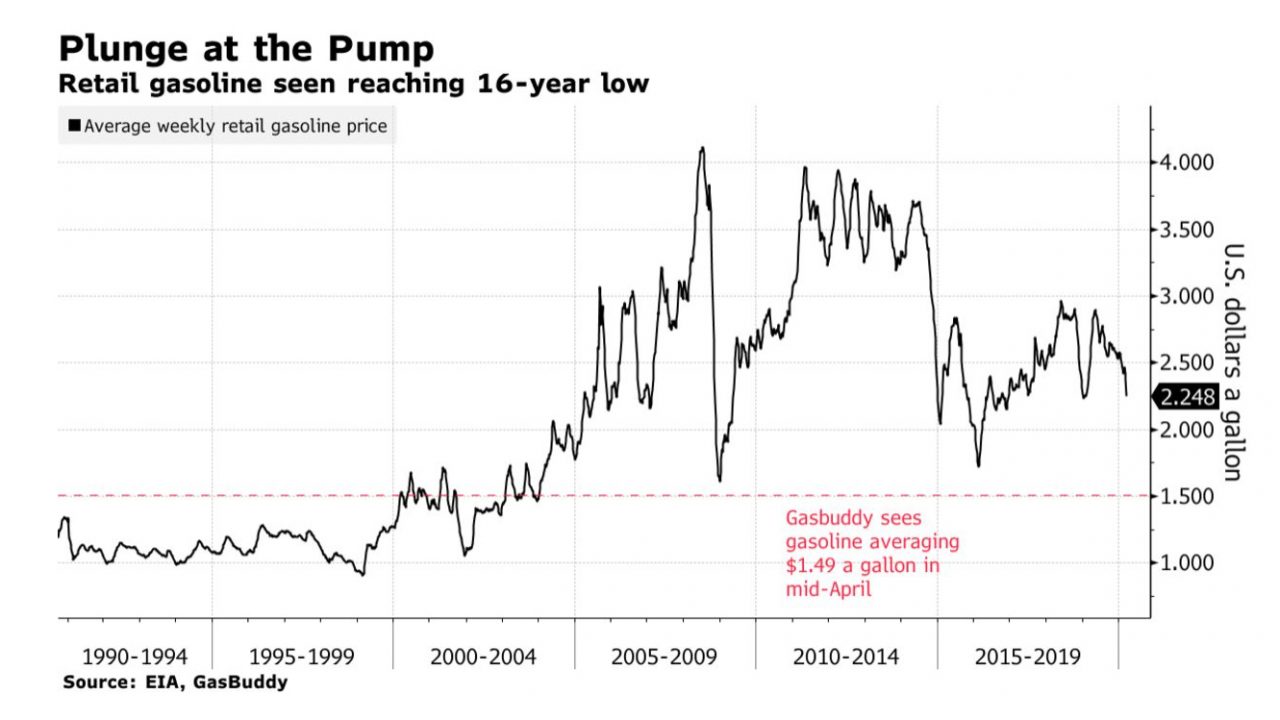
What a demand shock looks like…
Jeffrey Bair and Jacqueline Davalos, Bloomberg, include some nice charts in their piece on declining retail gasoline prices, here... (I’m quite sure
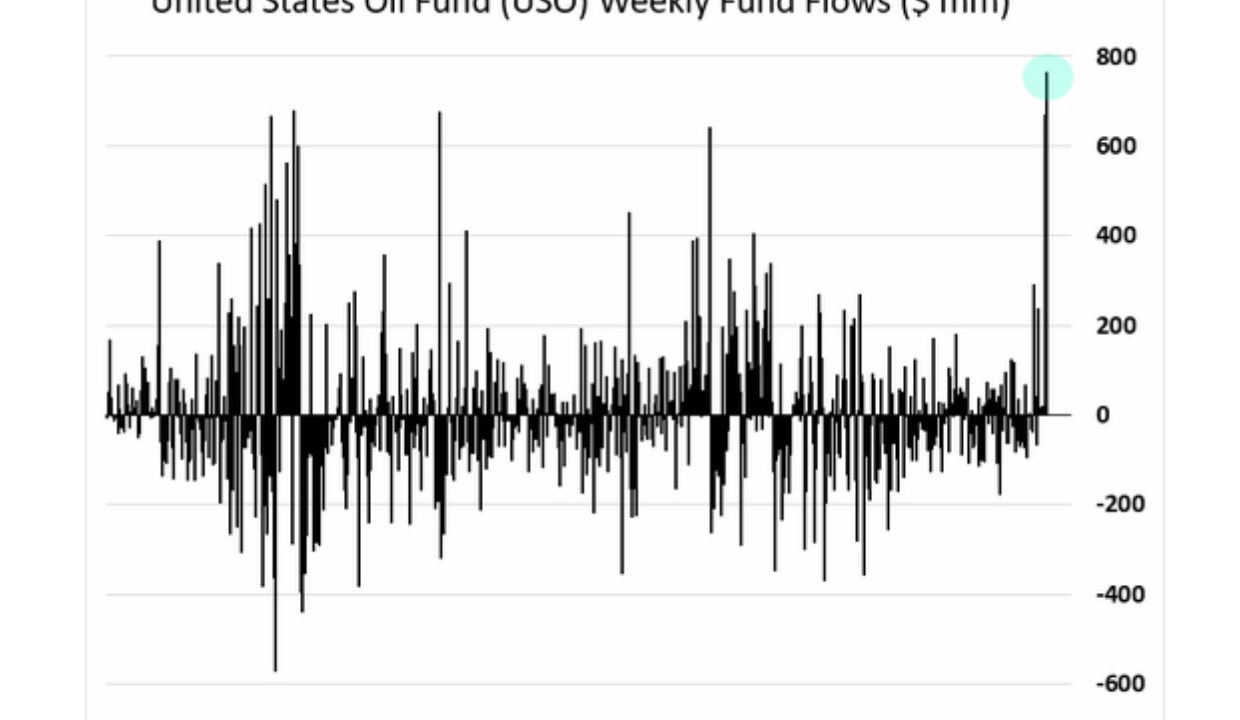
Investors “flooding” into crude oil… WSJ
This chart is from the Wall Street Journal’s, The Daily Shot, here...
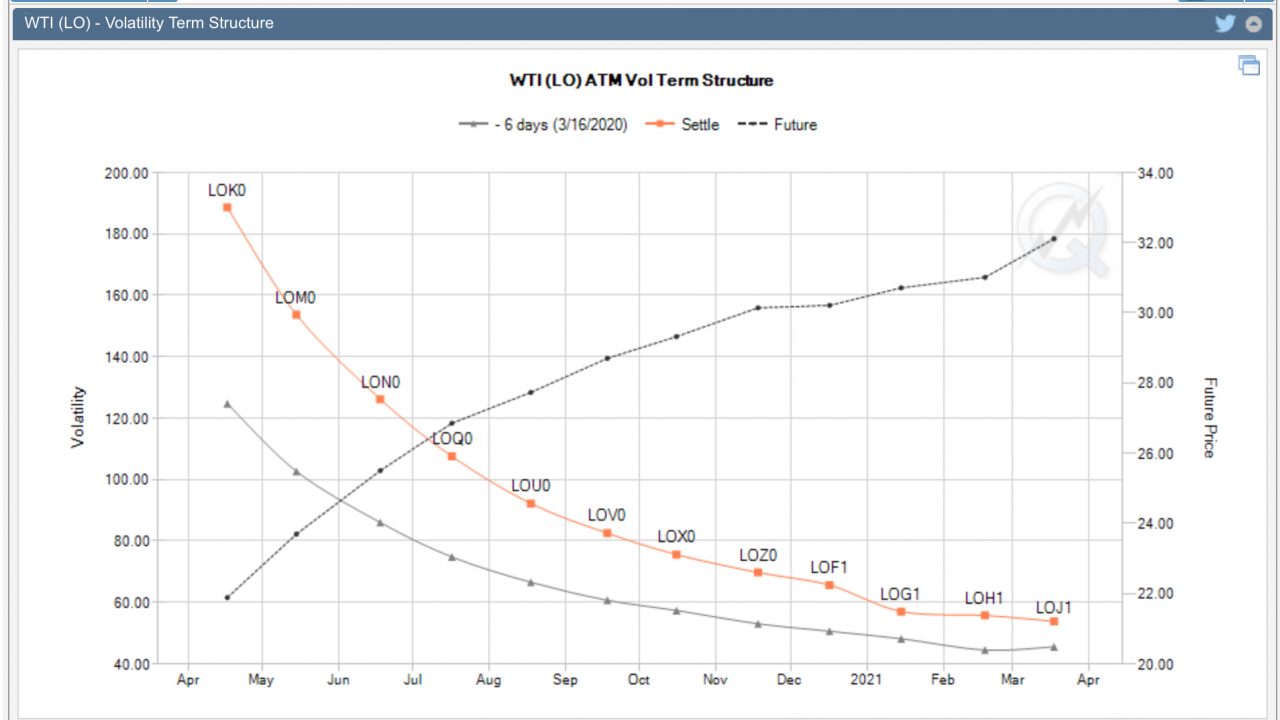
Volatility term structure…
I like this chart from the CME showing the implied vol curve for WTI options along with the futures curve... Yes, those numbers are correct and these
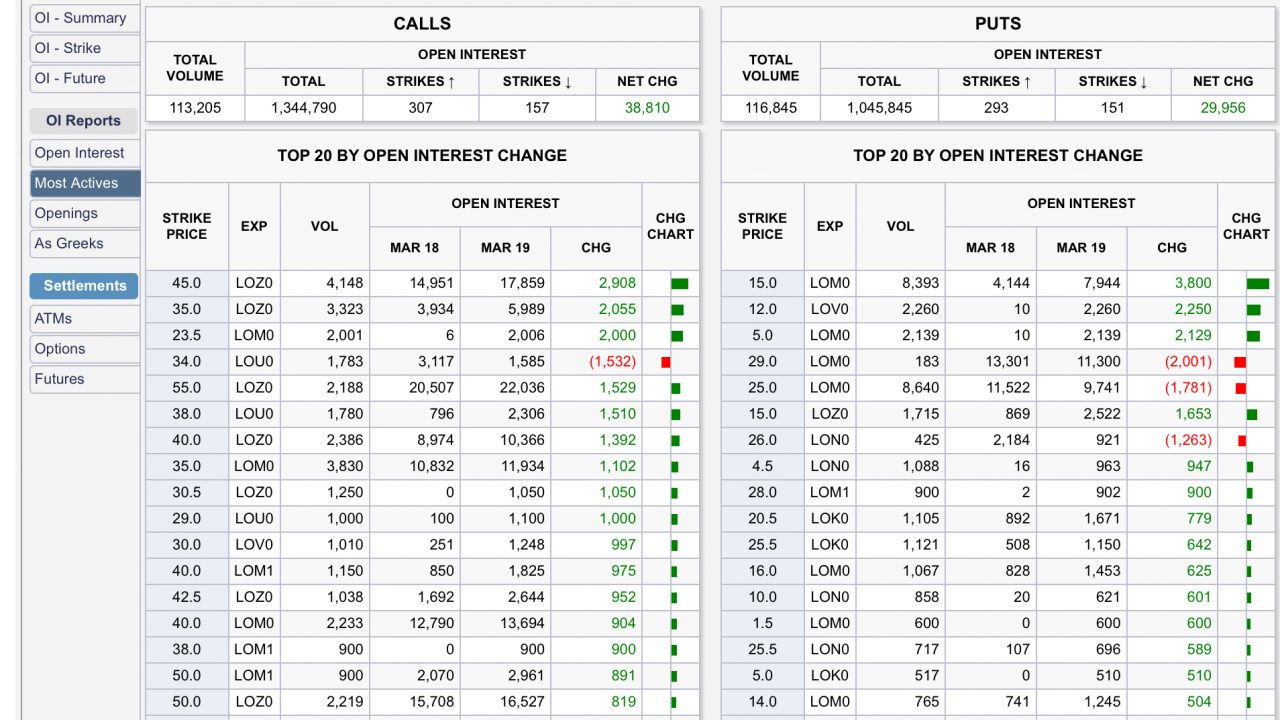
Can it get anymore bearish?
Here is a snapshot from the CME’s Most Active Strike tool, ranked by change in open interest... Is that a June $1.50 strike that traded 600x???
Amrita Sen talks to Bloomberg…
The link is here...
Pet peeve…
I know I’m a crank, but based on Bloomberg, CNBC and other financial media, crude oil now up 20% from it’s low, has corrected and is now in a bull
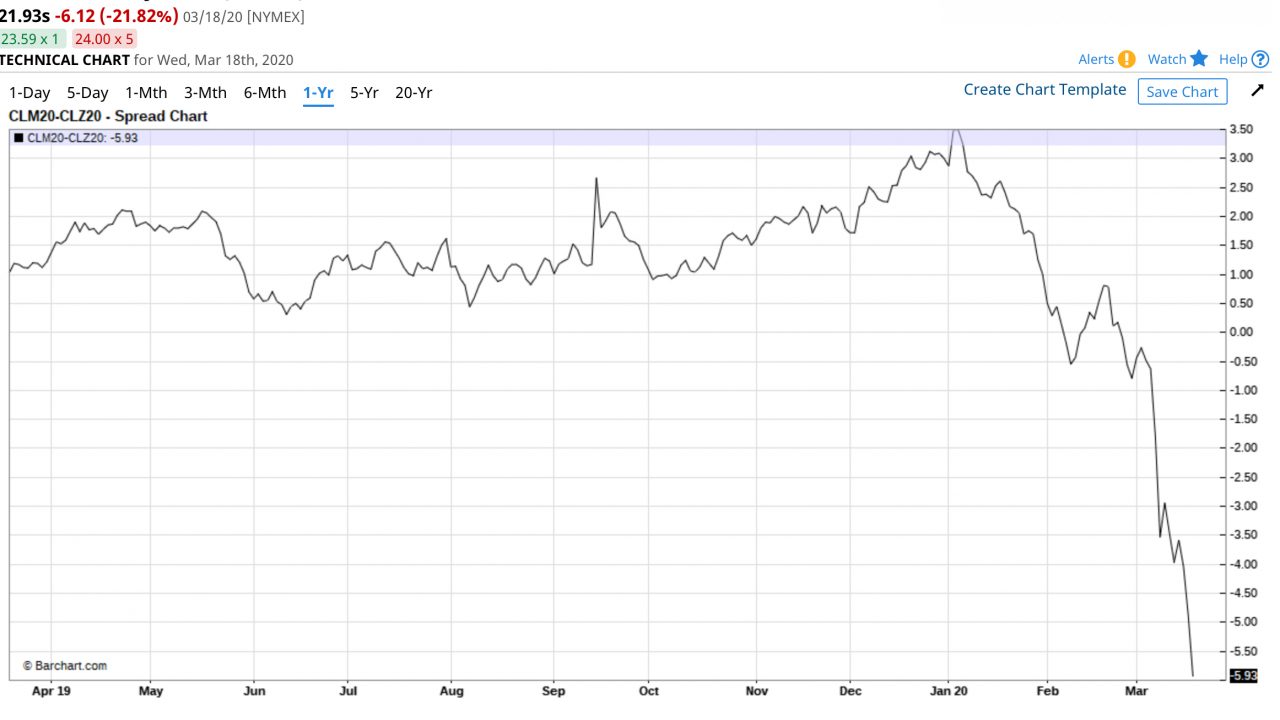
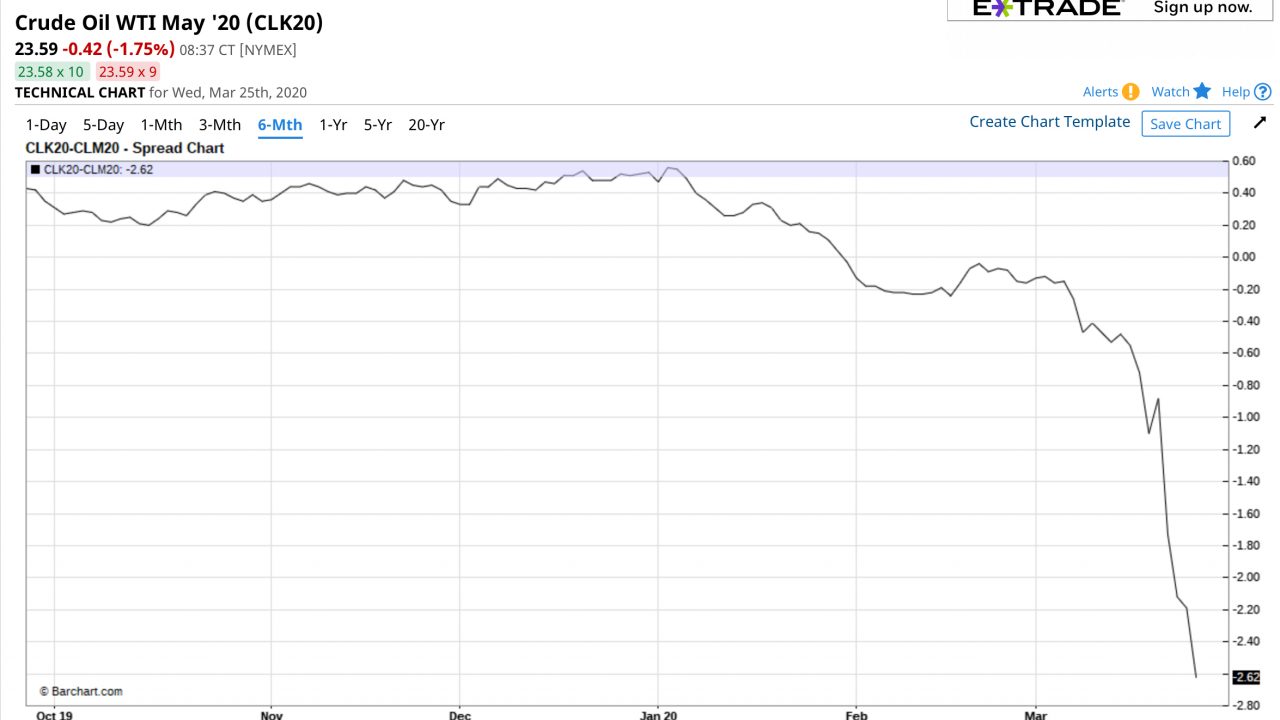
Spread options are trading…
Spread options on WTI are active due to the collapse of front to back spreads... Here is a look at the June20/Dec20 spread from barchart.com... Divide
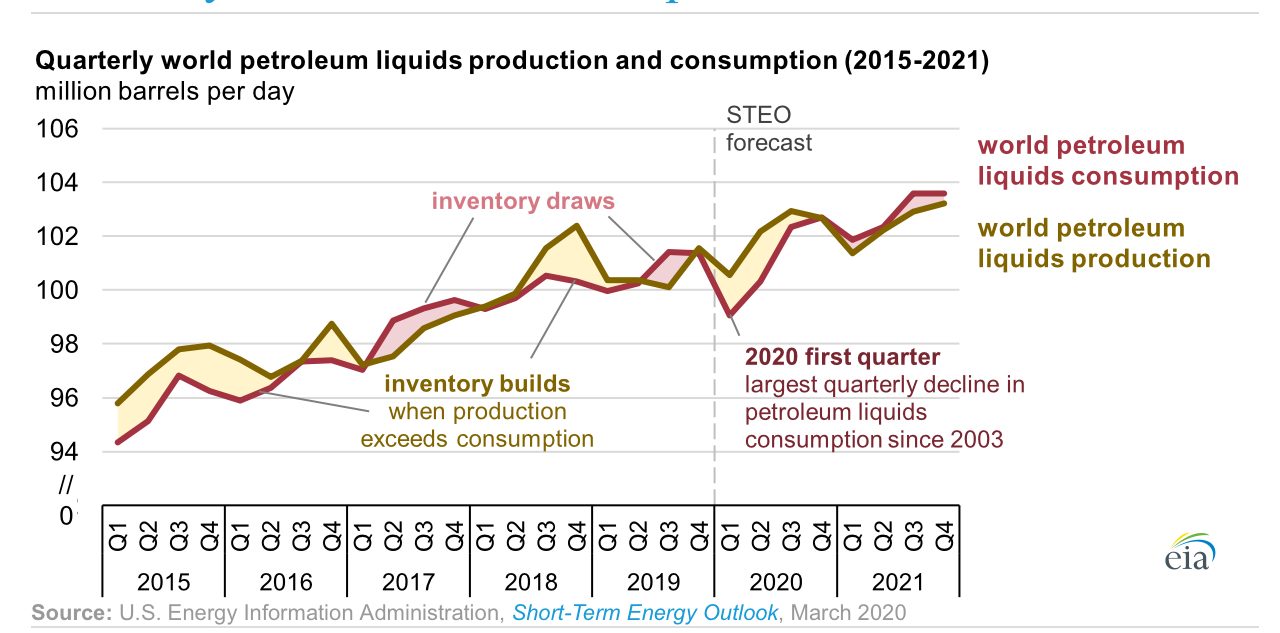
Inventories, call on OPEC oil… EIA
In Today in Energy, the EIA published some nice charts from the monthly STEO showing expected inventories and the call on OPEC crude...