• Skip to primary navigation
  • Skip to main content
  • Skip to primary sidebar
  • Skip to footer

203-656-1143

alebow@commodityresearchgroup.com

Commodity Research Group

AN INDEPENDENT COMMODITY RESEARCH GROUP

  • About Us
  • Our Associates
  • Research
  • Press
  • Podcast
    • All Episodes
    • Monthly Oil Market Report
    • Talkin’ EIAs
  • Blog
Contact Us

Commodity Research

May 27, 2020

Less Fizz for Soda…WSJ

Vipal Monga, Wall Street Journal, points out that less gasoline demand means less ethanol and less carbon dioxide... ”Carbon dioxide is a byproduct

Category iconCommodity Research

May 27, 2020

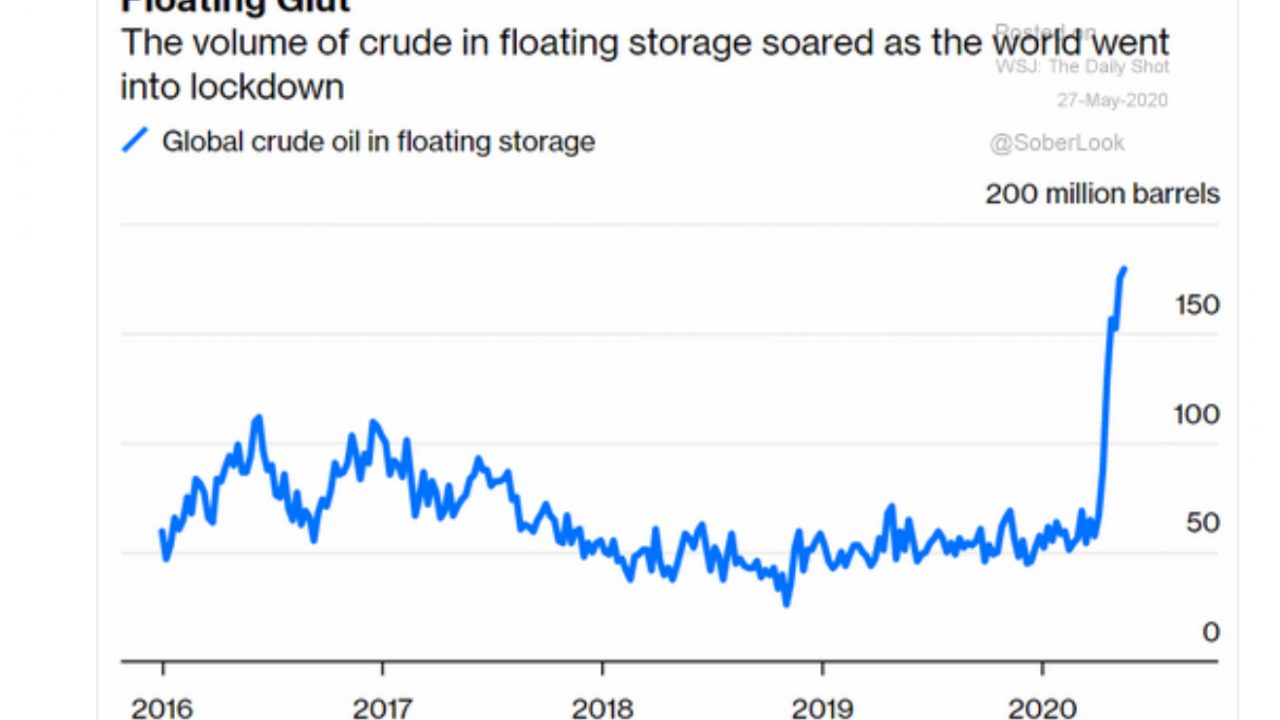
Oil, products in floating storage… WSJ

From the Wall Street Journal’s The Daily Shot:

Category iconCommodity Research

May 26, 2020

A bizarre bazaar… The Economist

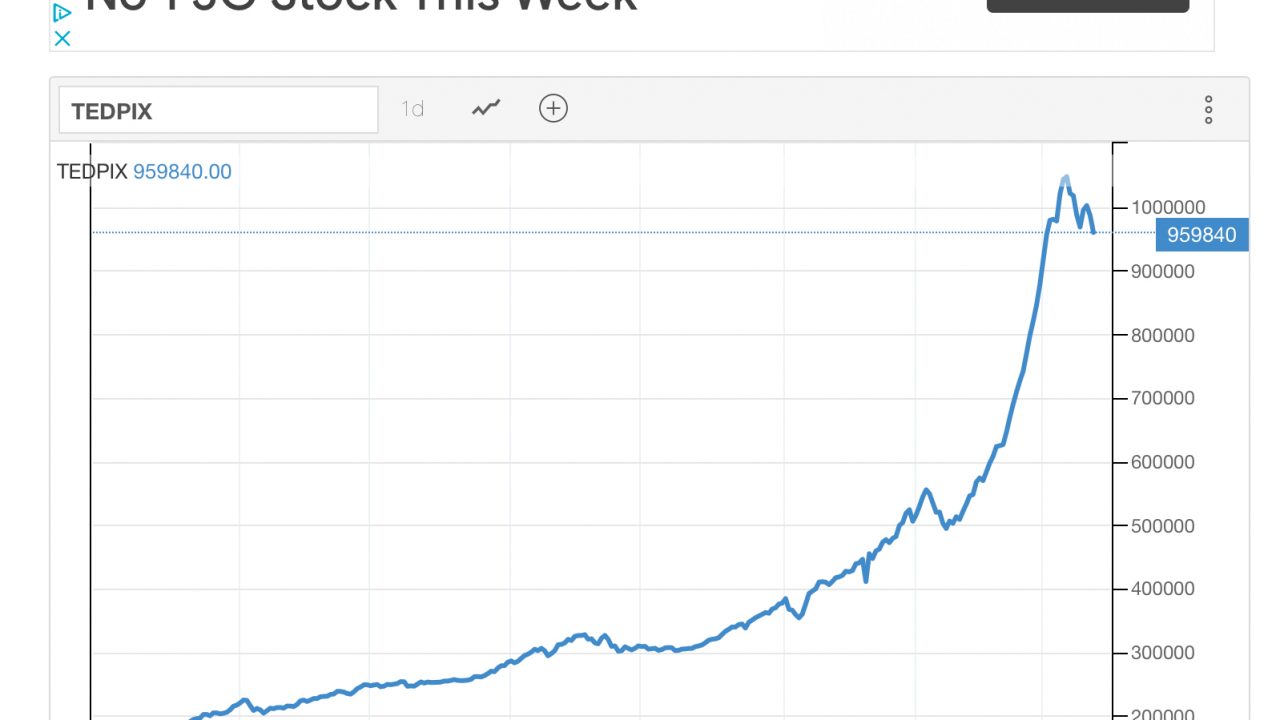
Iran's stock market is going wild, from The Economist: "Yet, somehow, the Iranian stockmarket is booming. Its main index, the Tedpix, has soared

Category iconCommodity Research

May 23, 2020

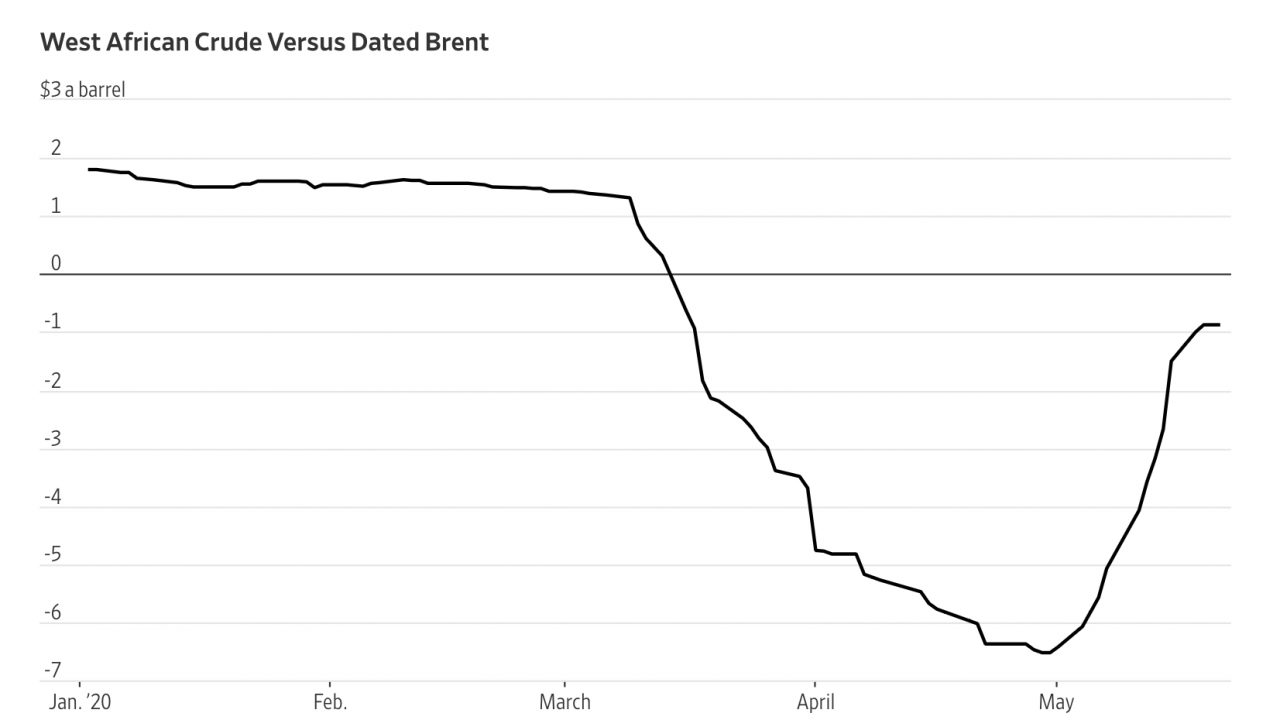
Less supply, more demand… WSJ

David Hodari, Wall Street Journal, explains the oil rally, here... ““We didn’t see tank tops at Cushing. Instead we’ve seen phenomenal levels of

Category iconCommodity Research

May 20, 2020

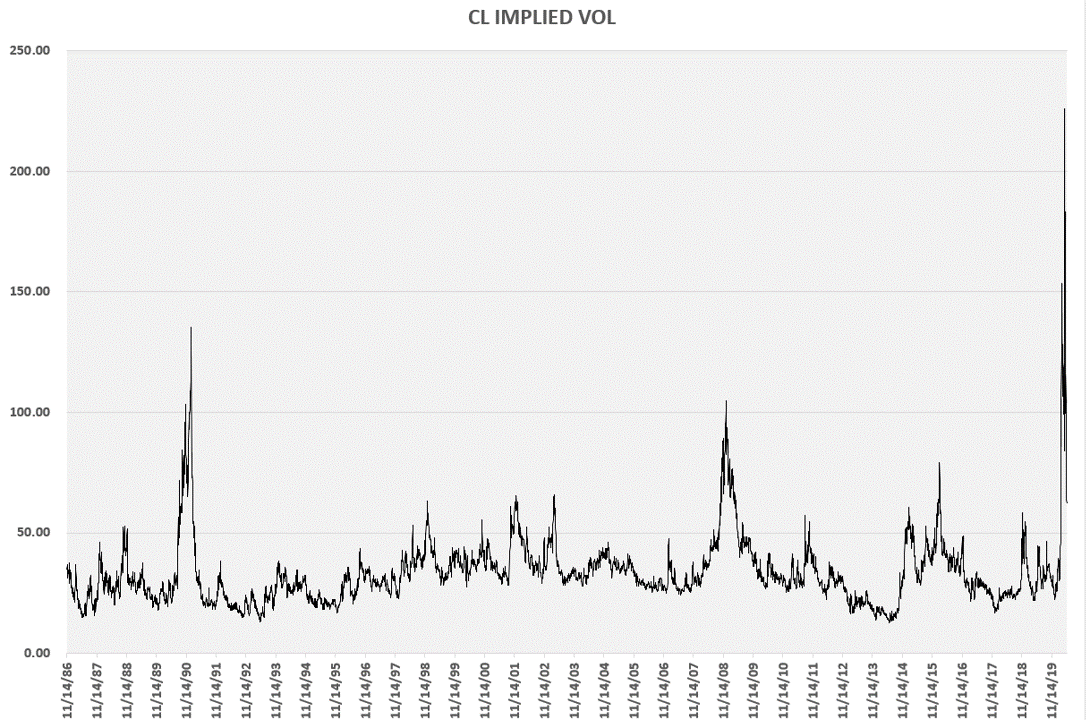
WTI implied vol update…

For perspective, here is my long term chart of implied volatility for WTI options (based on at the money, second nearby options)…  No new normal, no

Category iconCommodity Research

May 20, 2020

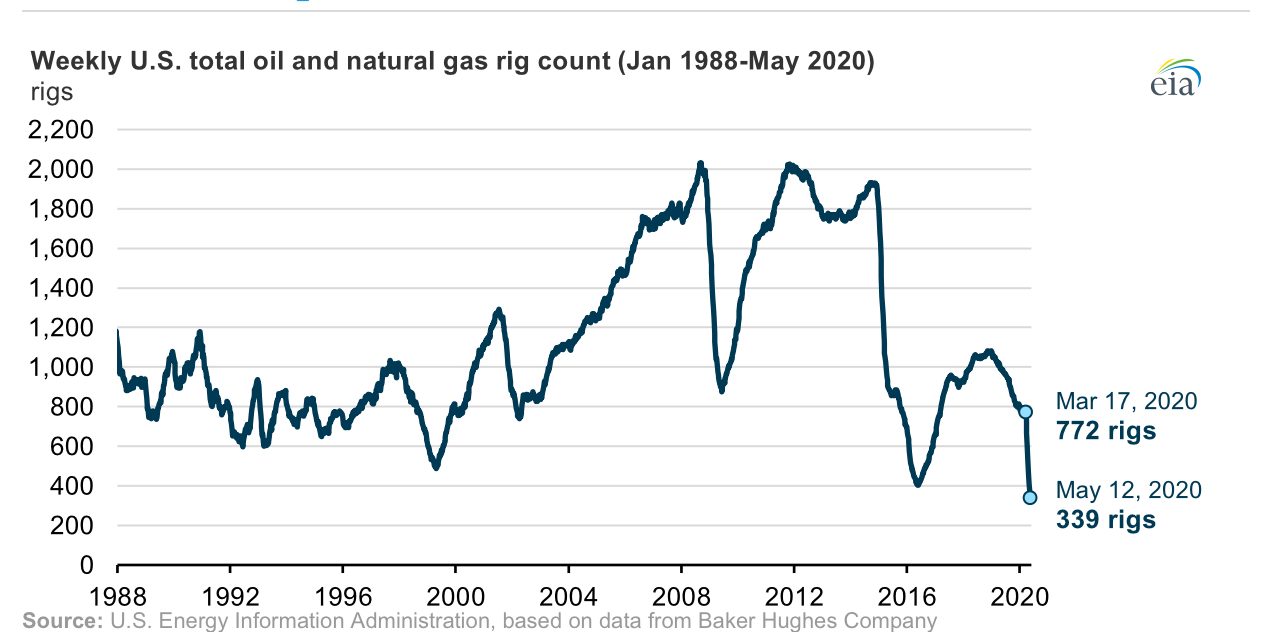
Active rigs in US at lowest on record… EIA

The EIA in Today in Energy focuses on US oil and gas rig counts, here... ”Changes in the number of oil rigs have historically followed changes in
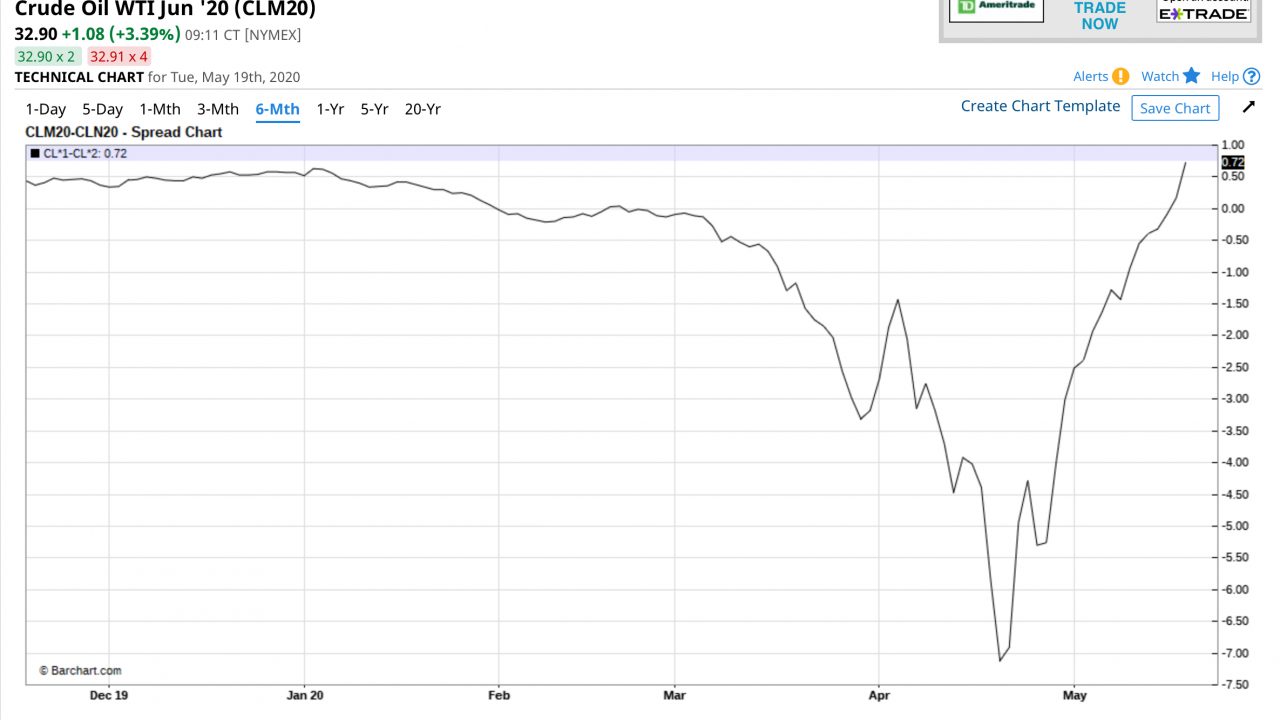
Category iconCommodity Research

May 19, 2020

One month later…

What a difference a month makes... Here is a chart from Barchart.com showing the June/July WTI spread:

Category iconCommodity Research

May 18, 2020

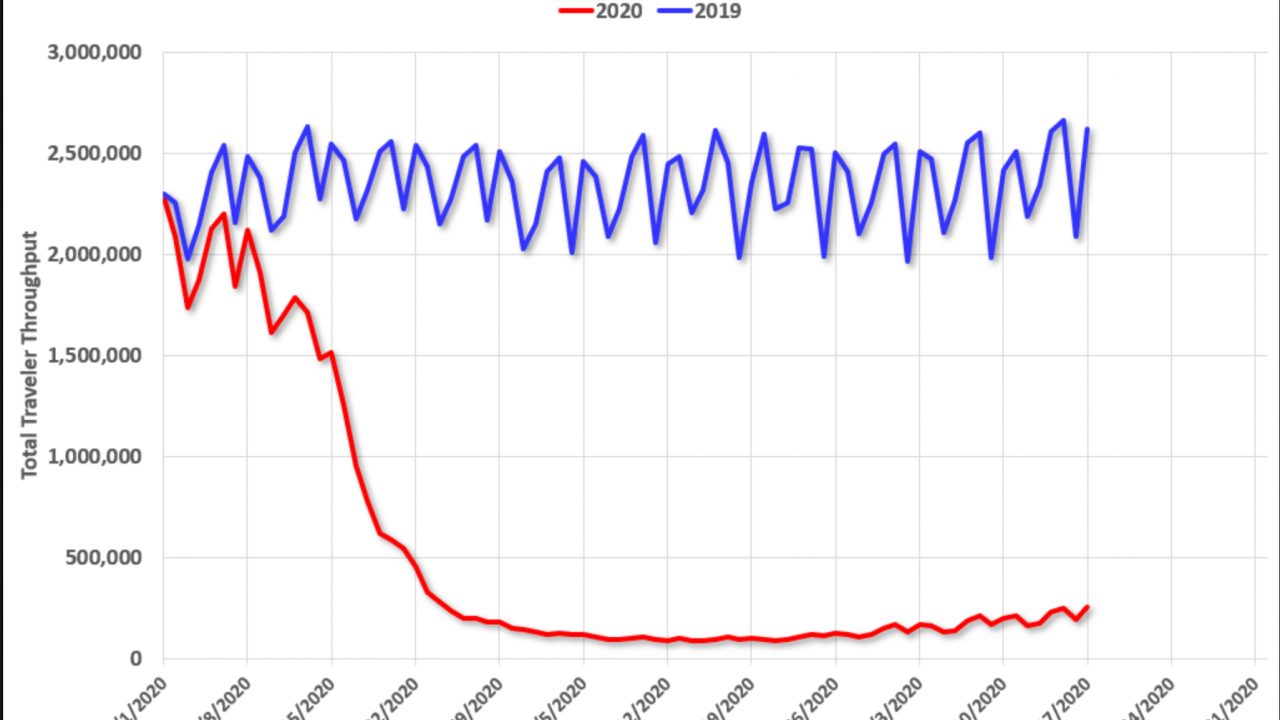
Six High Frequency Indicators… Calculated Risk

Calculated Risk has a nice post showing some economic indicators, here...

Category iconCommodity Research

May 14, 2020

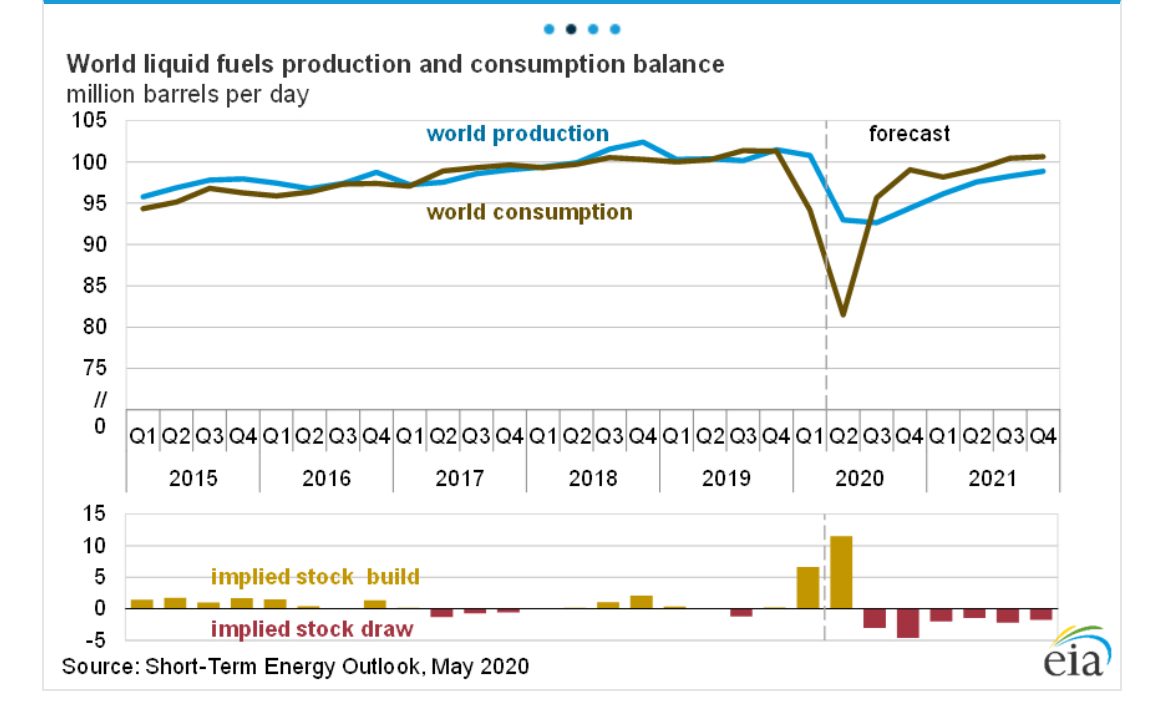
Supply/demand in a chart… EIA

This chart is from the EIA’s Short Term Energy report...

Category iconCommodity Research

  • « Go to Previous Page
  • Page 1
  • Interim pages omitted …
  • Page 67
  • Page 68
  • Page 69
  • Page 70
  • Page 71
  • Interim pages omitted …
  • Page 143
  • Go to Next Page »

Primary Sidebar

Recent Posts

  • Podcast: January 2025 Oil Market Analysis
  • Podcast: September 2024 Oil Market Analysis
  • Podcast: June 2024 Oil Market Analysis
  • Podcast: April 2024 Oil Market Analysis
  • Podcast: February 2024 Oil Market Analysis
  • Podcast: January 2024 Oil Market Analysis
  • Podcast: June 2023 Oil Market Analysis

Footer

Get in touch

Get professional market research now.

203-656-1143

alebow@commodityresearchgroup.com

Resources

  • Research
  • Press
  • Podcast
  • Blog
Copyright © 2026 Commodity Research Group. All rights reserved. Developed by EKT Interactive. Return to top