
Here are a couple of charts showing oil prices and implied volatility for WTI, from the Wall Street Journal’s “The Daily Shot”... Oil
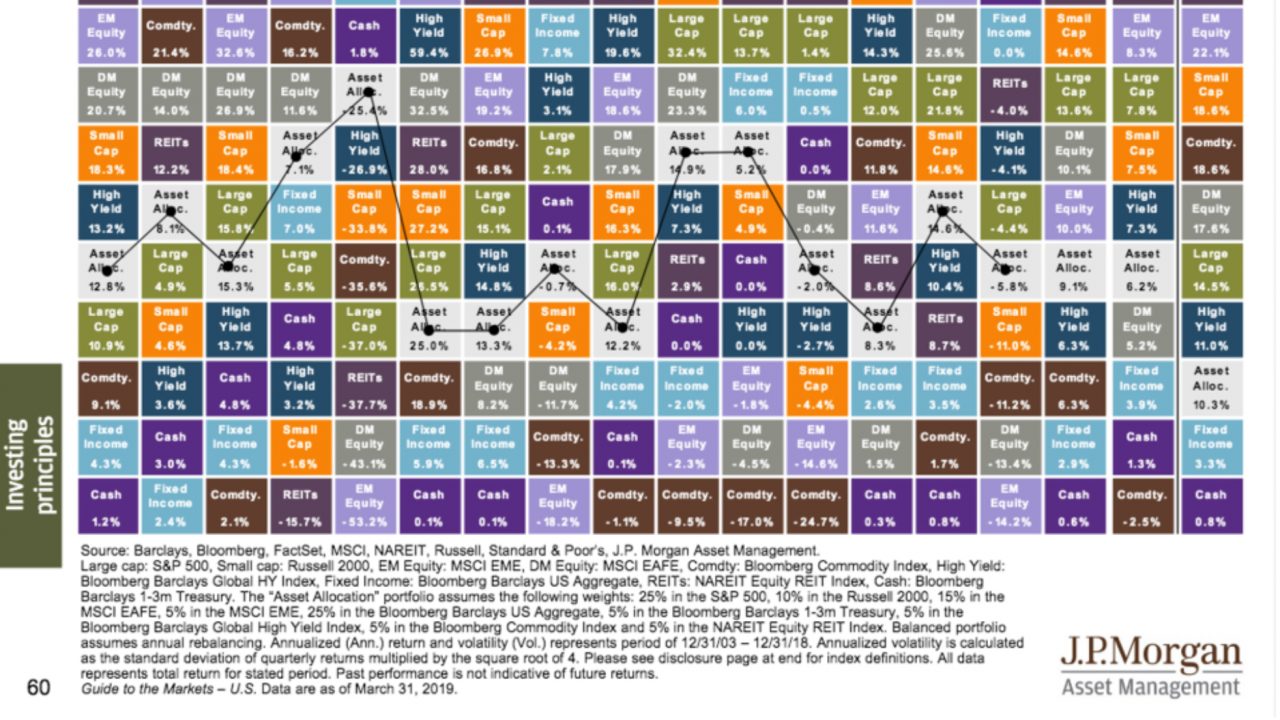
63 Charts… JP Morgan via Business Insider
They’re all here.. And, this one is worth repeating (note the long only commodity strategy!):
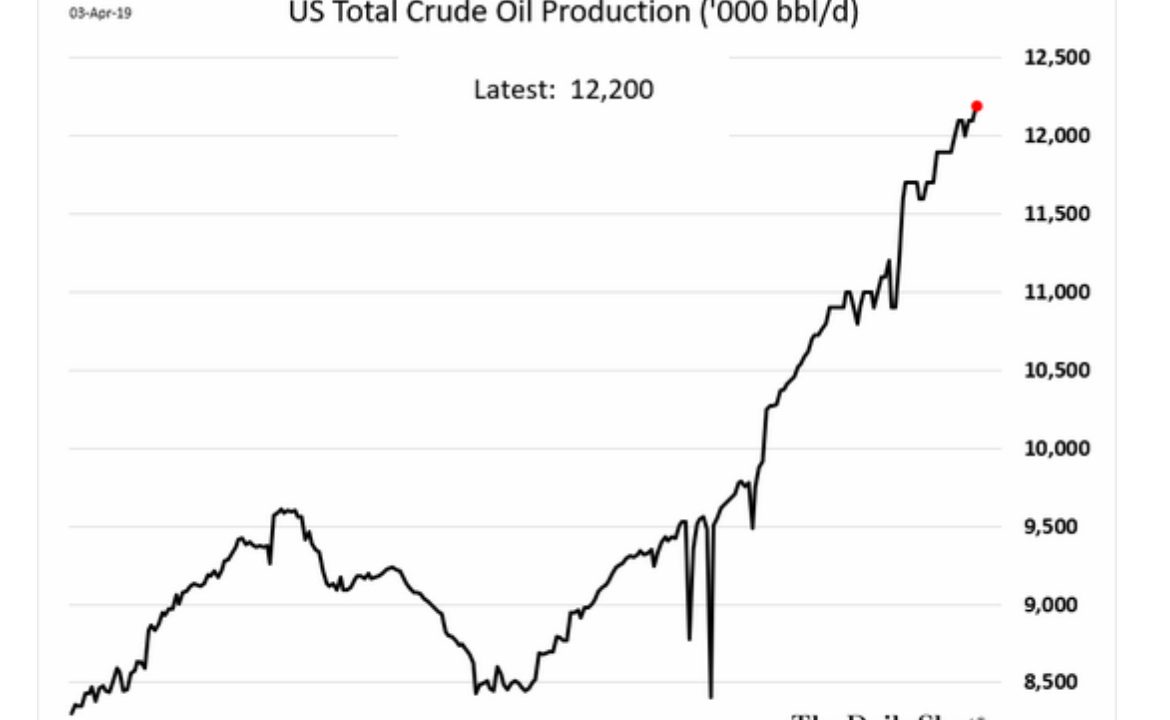
US oil production… WSJ
From The Daily Shot, here..

HGL’s and other products through the Panama Canal… EIA
The Energy Information Administration’s “This Week In Petroleum” focuses on movement of hydrocarbon gas liquids through the Panama Canal,

Lithium-Ion battery prices trending lower… Bloomberg
David R. Baker, makes the case for lithium-ion batteries, here... ”The batteries pouring from new factories in China, the U.S., Thailand and
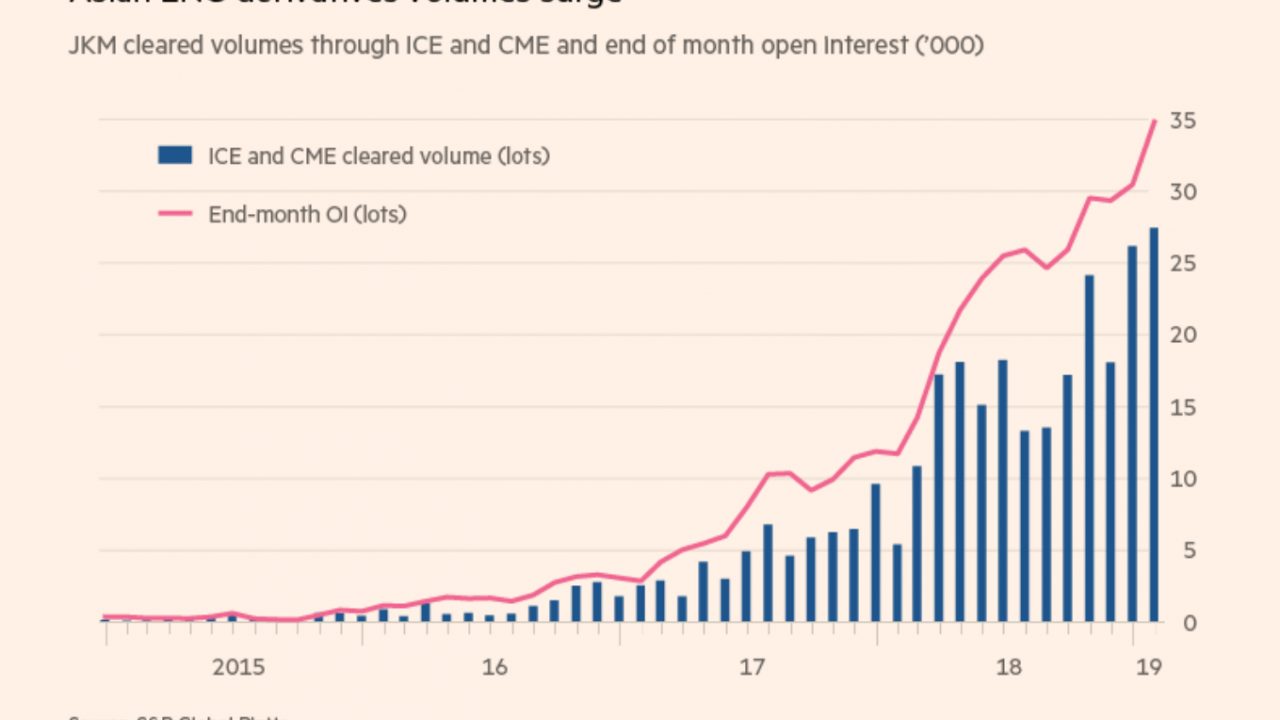
LNG global trade growth… Financial Times
Emiko Terazone, Financial Times, updates us on the growing volumes of global LNG trading, here...
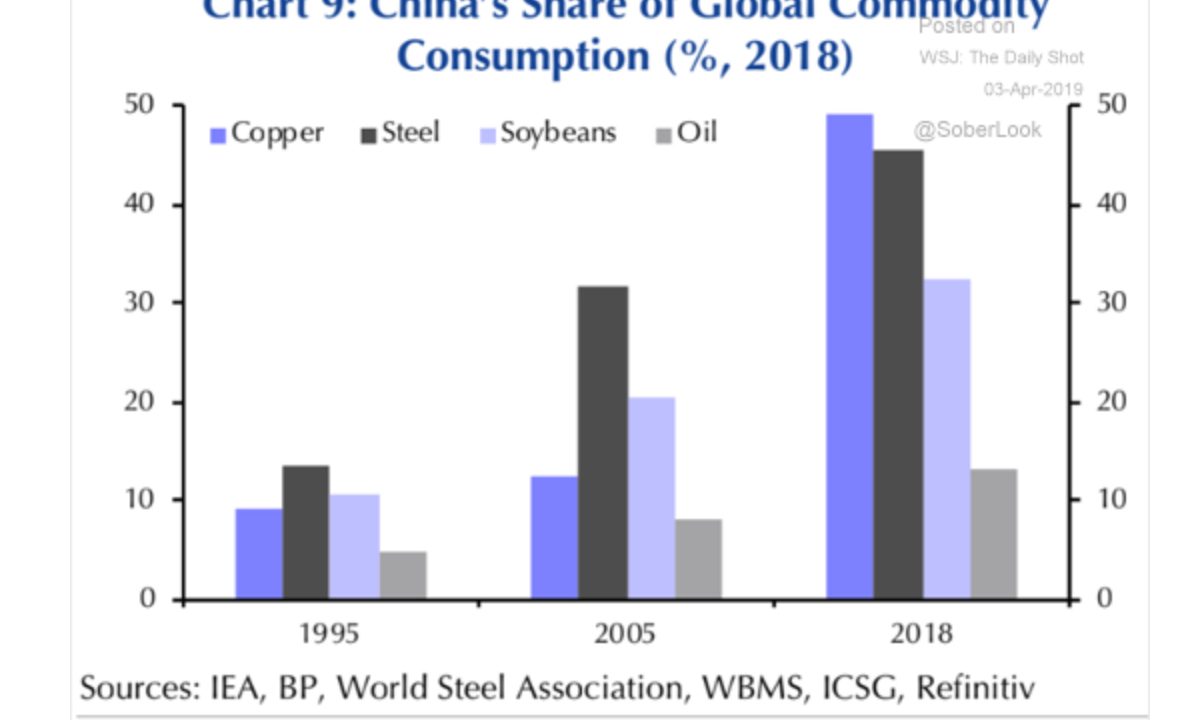
China’s share of commodity consumption… WSJ
From The Wall Street Journal, here...
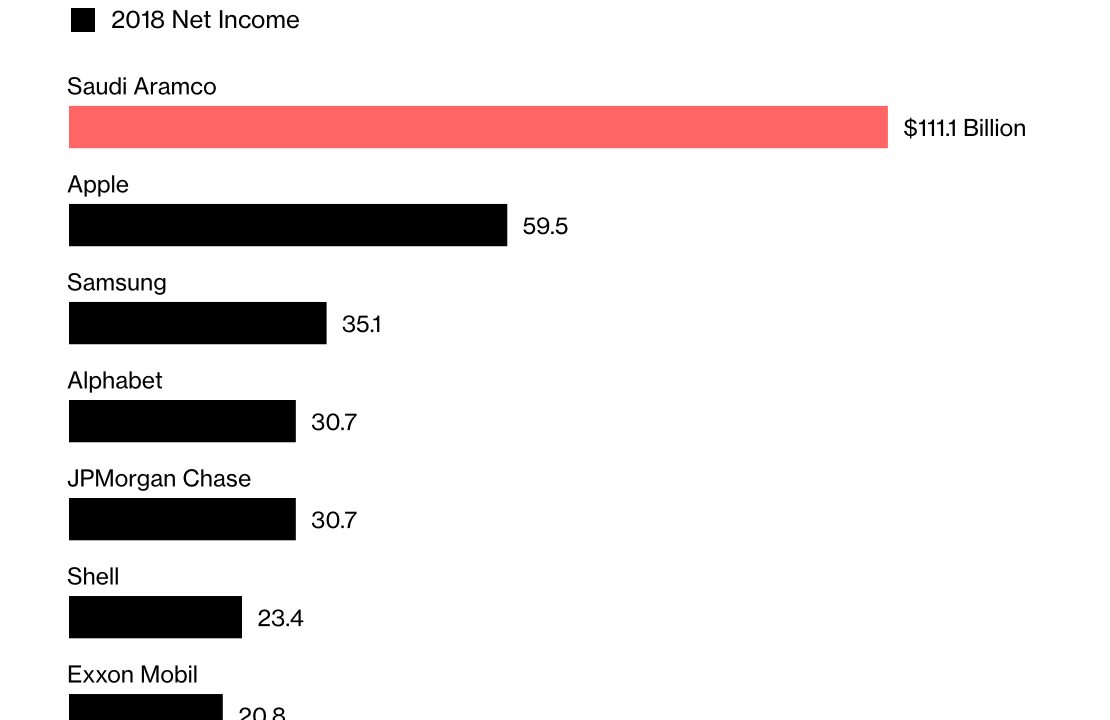
Aramco’s Big Reveal… Bloomberg
Mohammed Sergei, Bloomberg, tells us 7 things about Aramco, here... ”Jealously guarded financial data about the kingdom’s prized asset were
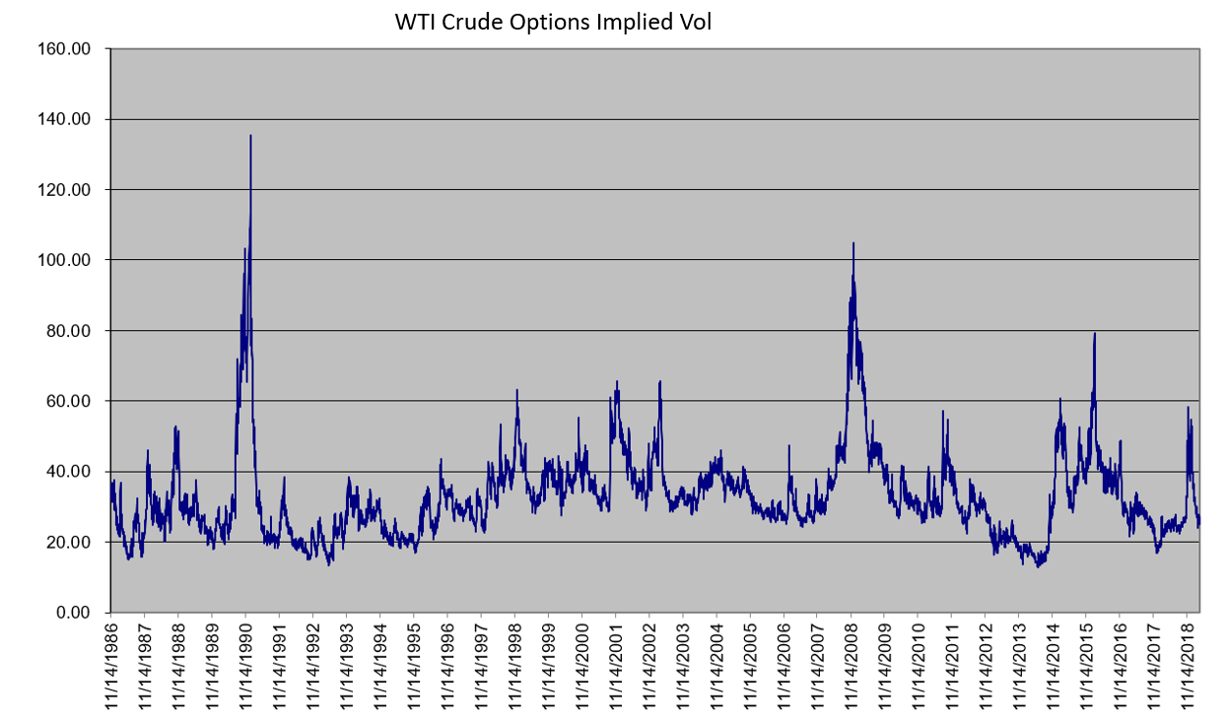
WTI options implied vol chart…
Options update... WTI crude oil options traded a measly 97,597 contracts per day in March, which, year to date, is down 41.1%... Lots of talk going on