BarclayHedge (not the bank) shows CTA performance over the years in a table and chart:
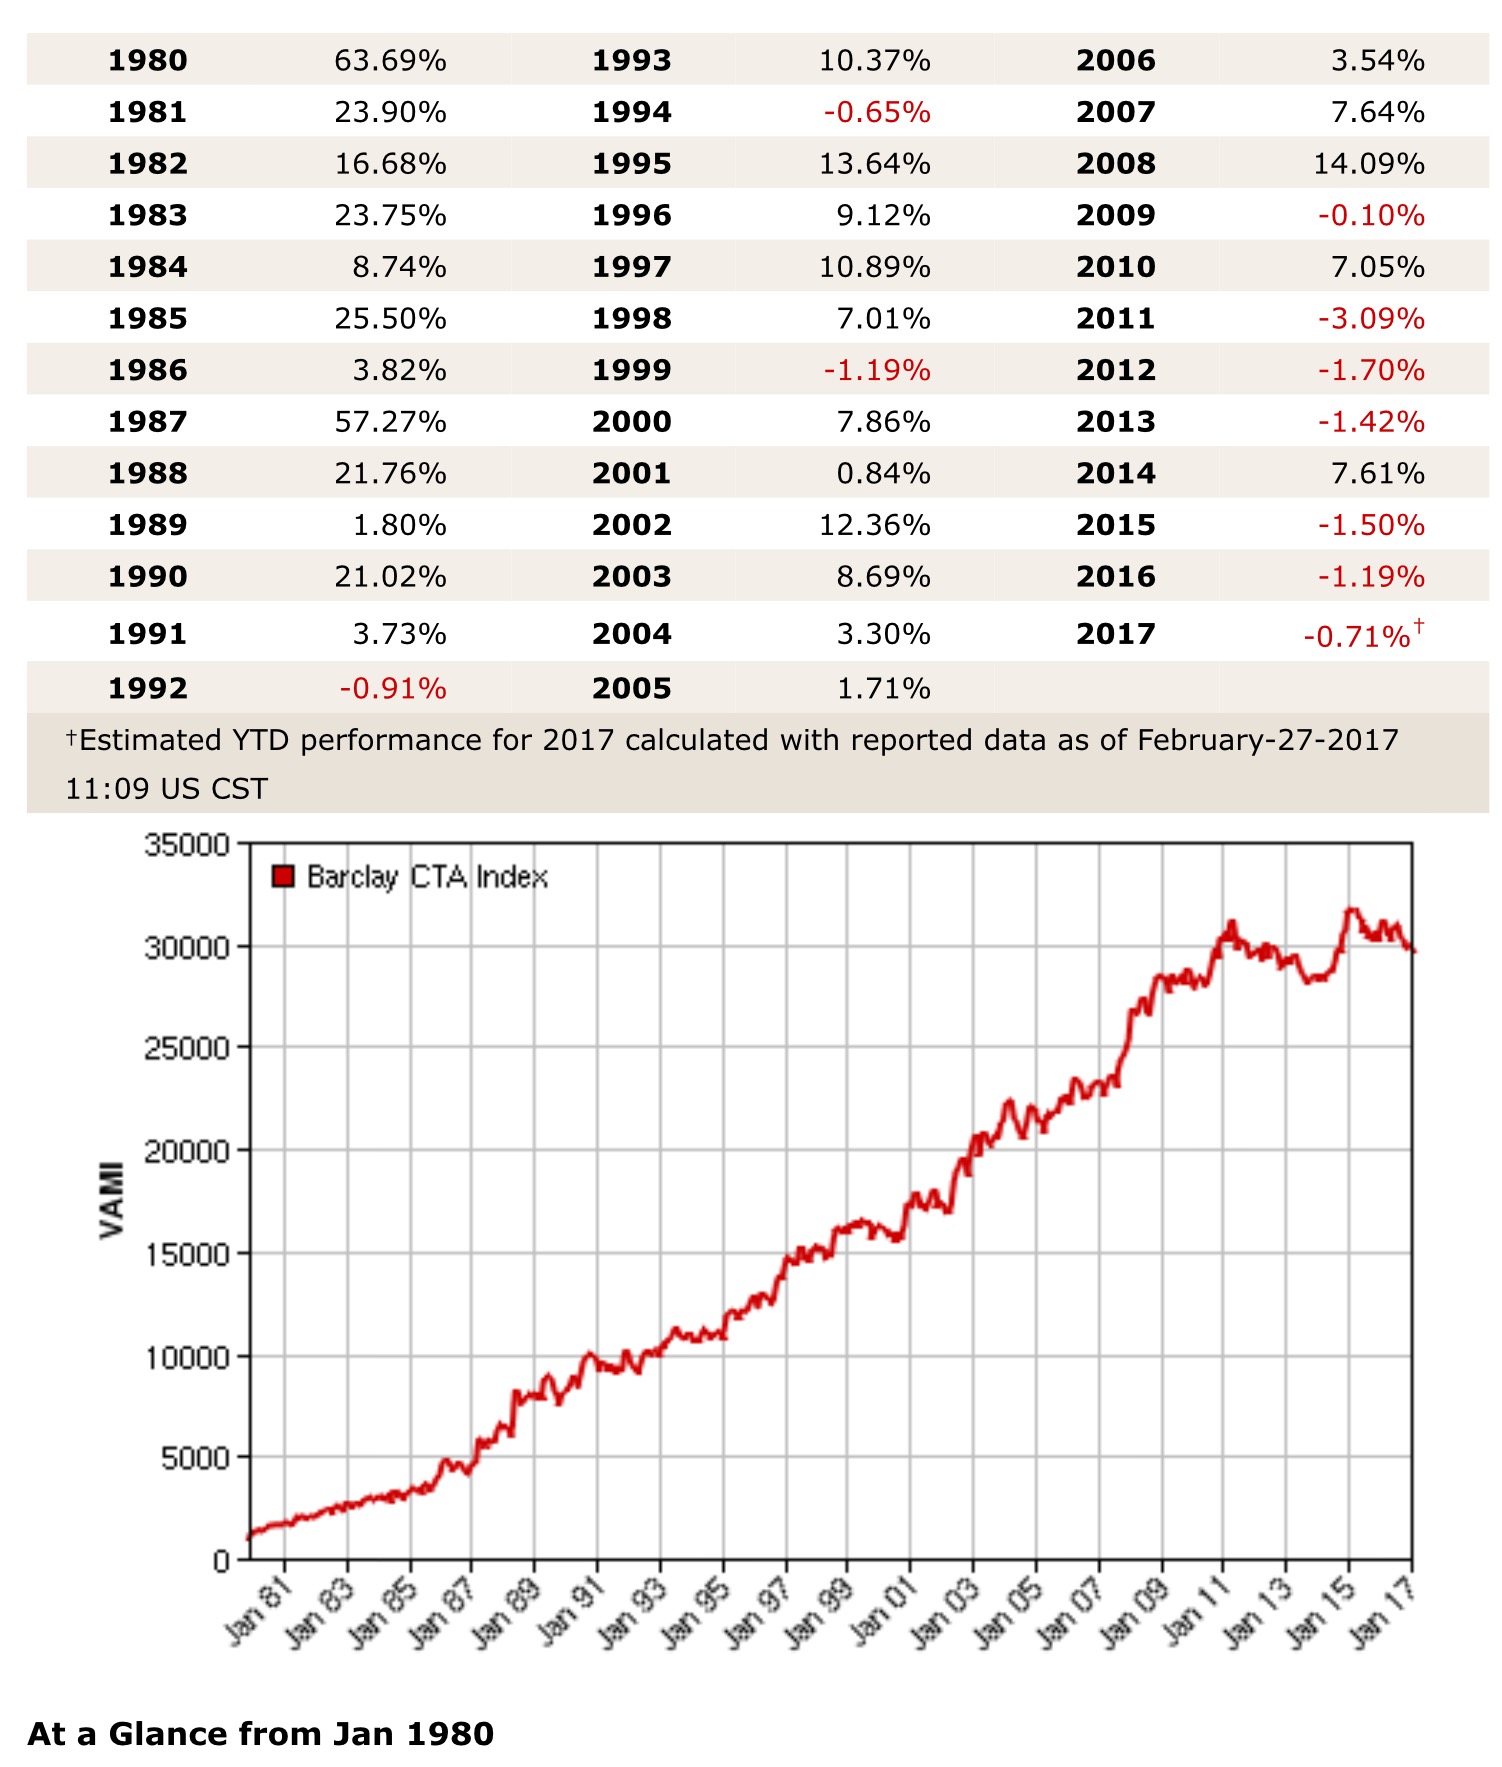
What a difference in returns between the decades of 1980’s and the 2010’s! Might the amount of assets under management by CTA’s have something to do with it? Also from BarclayHedge is a table showing explosive growth in Money invested in CTA’s:

And, related to oil, from Reuters:
“Money managers also raised their bullish U.S. crude futures and options positions in the week to Feb. 21 to the highest on record, the U.S. Commodity Futures Trading Commission (CFTC) said on Friday.
Investors now hold 951,312 lots’ worth of U.S. and Brent crude futures and options, equivalent to nearly 1 billion barrels of oil valued at more than $52 billion, based on current Brent and WTI benchmark prices.”
Is this a bullish or bearish signal?
Leave a Reply