• Skip to primary navigation
  • Skip to main content
  • Skip to primary sidebar
  • Skip to footer

203-656-1143

alebow@commodityresearchgroup.com

Commodity Research Group

AN INDEPENDENT COMMODITY RESEARCH GROUP

  • About Us
  • Our Associates
  • Research
  • Press
  • Podcast
    • All Episodes
    • Monthly Oil Market Report
    • Talkin’ EIAs
  • Blog
Contact Us

Jim Colburn

January 11, 2016

One Market Prediction Is Sure: Wall Street Will Be Wrong

The title is from an excellent article from the underrated business section of the NY

Category iconUncategorized

January 8, 2016

The Recession Caused By Lower Oil Prices… WSJ

While I don't agree with everything in this article from today's Wall Street Journal, it is worth

Category iconUncategorized

January 8, 2016

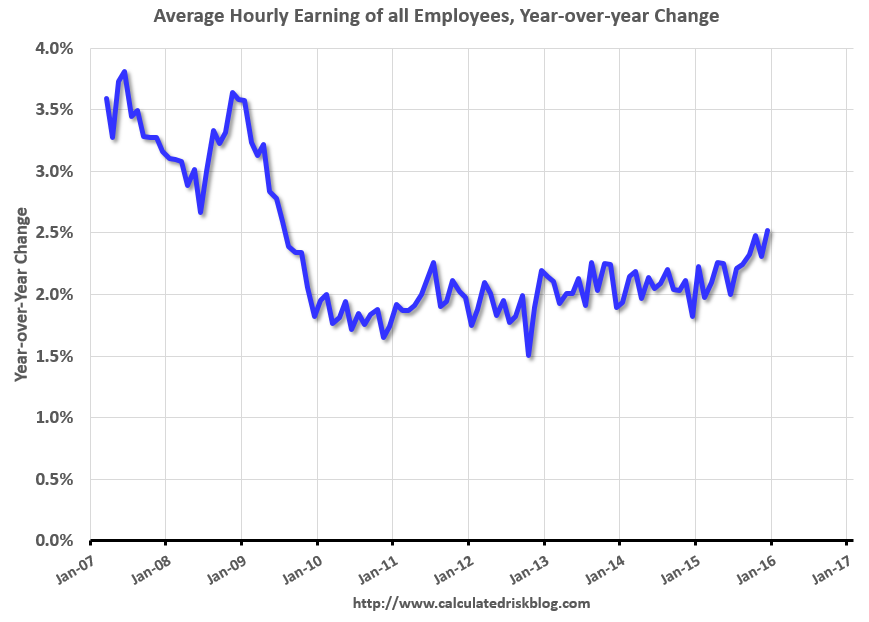
Average Hourly Earnings

Calculated Risk is an excellent blog for economic news: http://www.calculatedriskblog.com The sky is always falling, but here is a good trend from

Category iconUncategorized

January 7, 2016

A case for $5 oil…

From the Economist: http://www.economist.com/node/188181 Oh, wait, this is from 1999!: "Yet here is a thought: $10 might actually be too

Category iconUncategorized

January 6, 2016

The Domino Effect

RBN Energy is probably the best blog on US energy fundamentals ... And now Rusty Braziel has a book

Category iconUncategorized

January 6, 2016

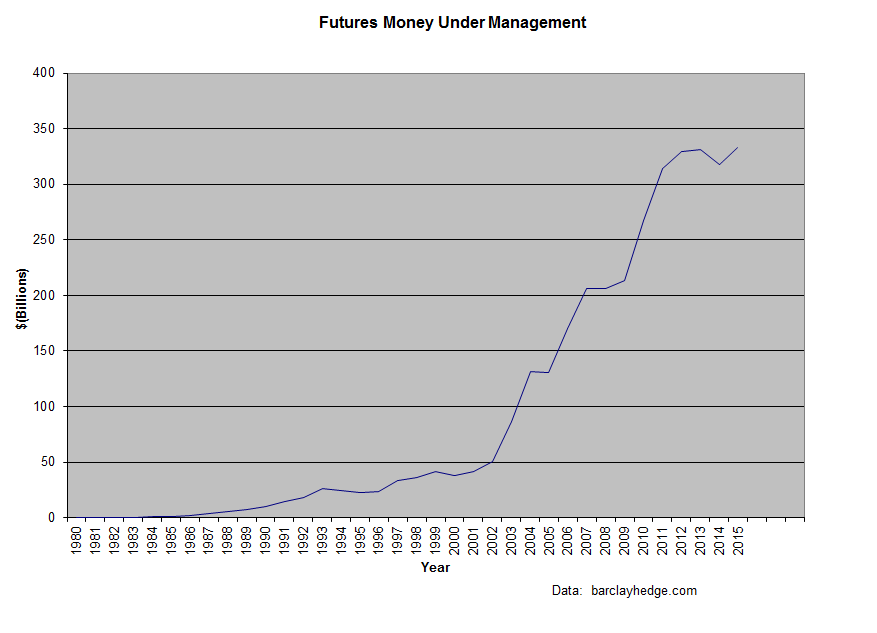
Assets under management, CTA’S

Here is a chart of assets under management for CTA's (commodity trading advisors) from barclayhedge.com...  BarclayHedge is an excellent site for fund

Category iconUncategorized

January 5, 2016

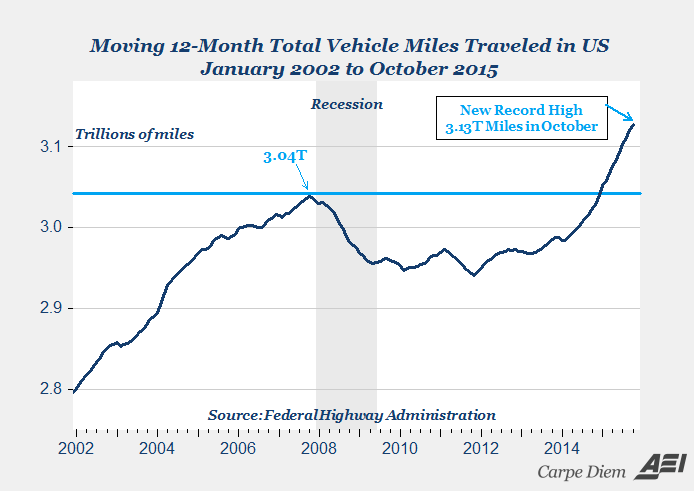
Total Vehicle Miles, via Carpe Diem

The chart is from Carpe Diem,(https://www.aei.org/publication/monday-morning-links-28/)...  

Category iconUncategorized

January 4, 2016

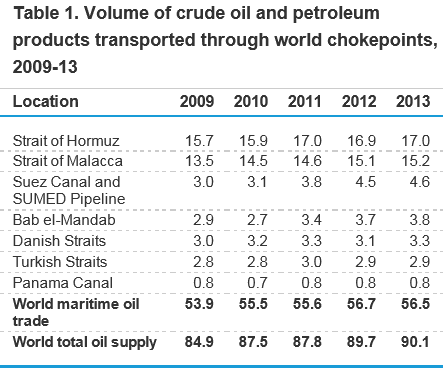
World Oil Transit Chokepoints, EIA

From the EIA, November 2014: http://www.eia.gov/beta/international/analysis_includes/special_topics/World_Oil_Transit_Chokepoints/wotc.pdf "Located

Category iconUncategorized

January 4, 2016

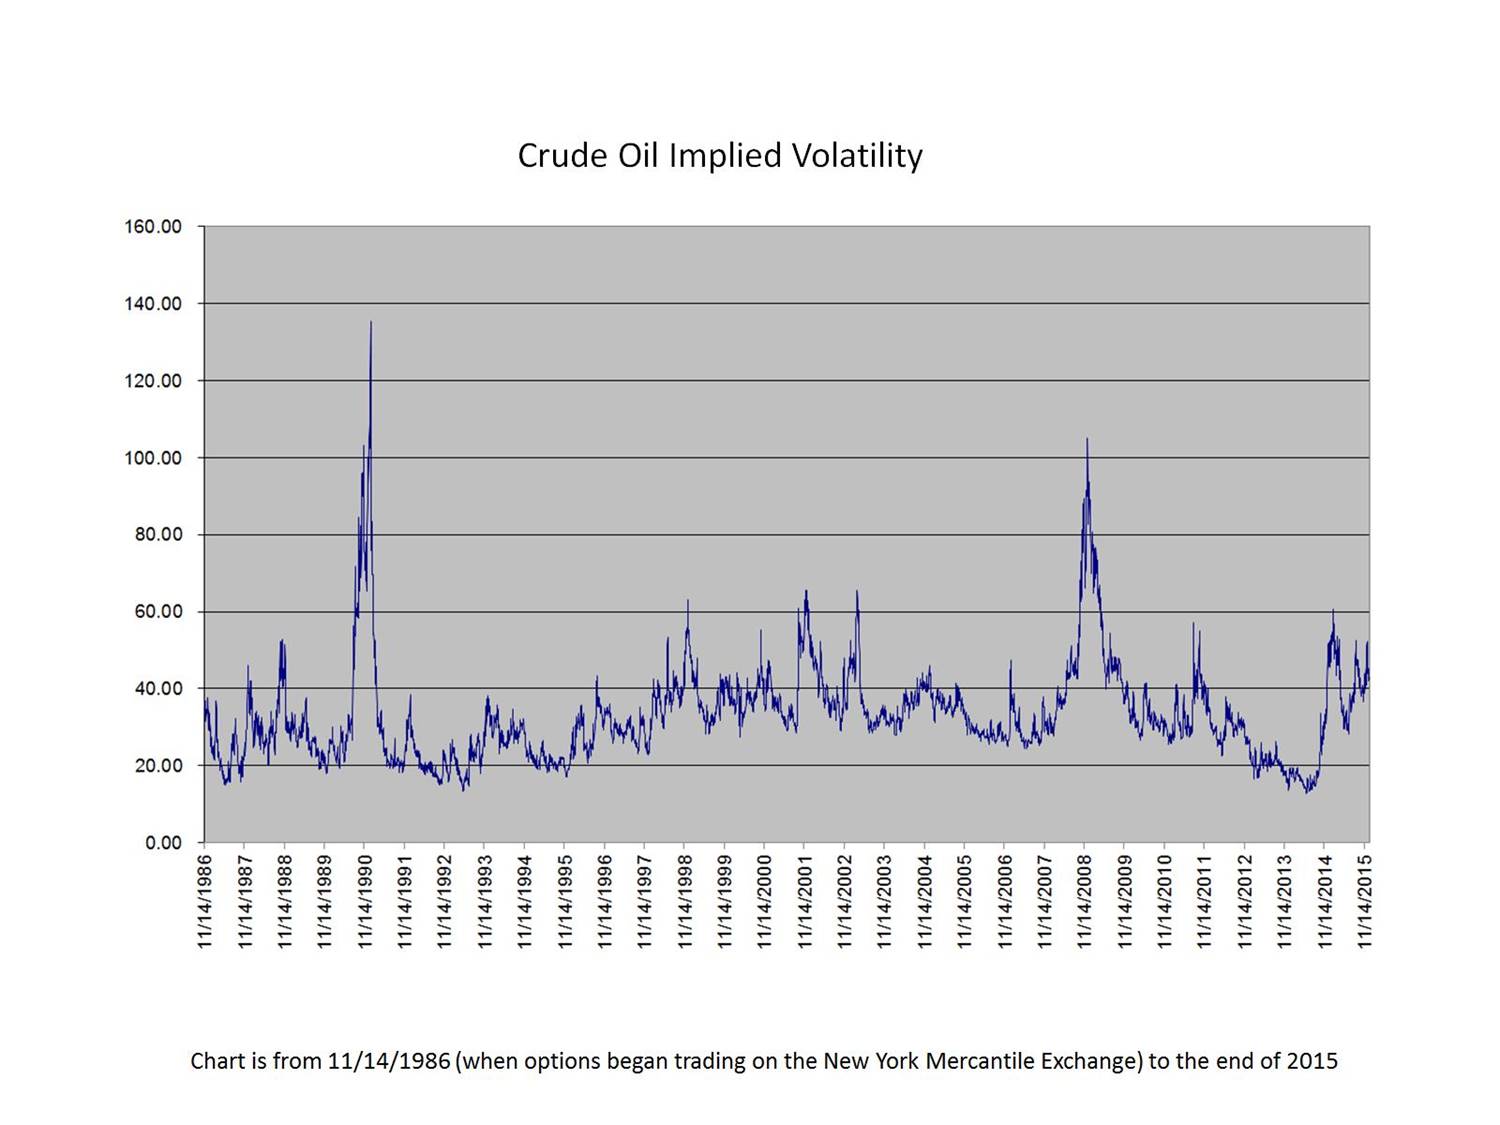
Crude Oil Implied Volatility (historical perspective)

Here is the all time implied vol chart for WTI since options began trading on November 14, 1986... The long term average is 32.9, with a high of 135.4

Category iconUncategorized

  • « Go to Previous Page
  • Page 1
  • Interim pages omitted …
  • Page 269
  • Page 270
  • Page 271
  • Page 272
  • Go to Next Page »

Primary Sidebar

Recent Posts

  • Podcast: January 2025 Oil Market Analysis
  • Podcast: September 2024 Oil Market Analysis
  • Podcast: June 2024 Oil Market Analysis
  • Podcast: April 2024 Oil Market Analysis
  • Podcast: February 2024 Oil Market Analysis
  • Podcast: January 2024 Oil Market Analysis
  • Podcast: June 2023 Oil Market Analysis

Footer

Get in touch

Get professional market research now.

203-656-1143

alebow@commodityresearchgroup.com

Resources

  • Research
  • Press
  • Podcast
  • Blog
Copyright © 2025 Commodity Research Group. All rights reserved. Developed by EKT Interactive. Return to top