
From Oppenheimer, here is a quilt (I love the quilt!)showing returns from different asset classes over 10 years: One note... The quilt has an

Days supply… This Week in Petroleum
"Days supply" is a measure which compares stock levels to current demand... Stock levels divided by daily demand gives us a sense of how tight or
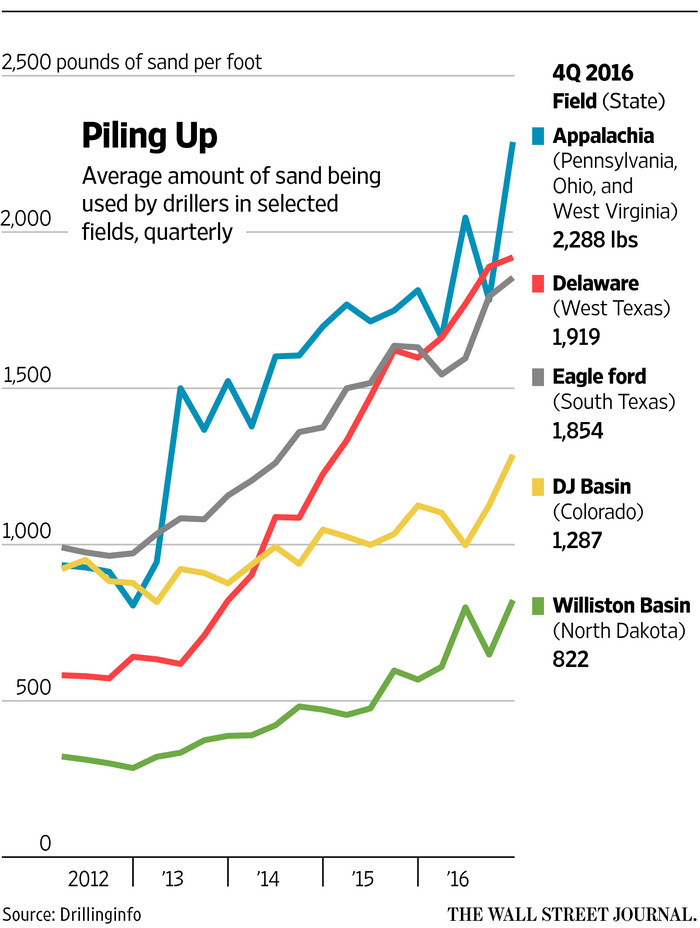
Booming demand…for sand… WSJ
Used in fracking, here is the Wall Street Journal on the demand for sand: "The tightening market has already sent prices marching toward $40 a ton
ICE, Platts to Launch LNG futures contracts… WSJ
In the race to develop a world benchmark for a commodity increasing in importance globally, ICE is winning... Here is the Wall Street Journal: "By

High-Frequency Traders Fall on Hard Times… WSJ
It's an arms race, here is the WSJ: "When many high-speed traders got their start in the 2000s, the leading technology for transmitting data was

Glencore, zinc market… WSJ
Glencore's relationship with the zinc market is described well here in an article from the WSJ... Glencore's cut back in production helped contribute
Too much oil… The Economist
The Economist discusses oil in storage here... I focused on Hillary Stevenson's comment of the average cost to store a barrel: "Hillary Stevenson

Saudi oil production… WSJ
The Wall Street Journal writes about OPEC extending supply cuts... here is Saudi Oil Minister Falih: "Inventories haven’t fallen as OPEC members

This Week in Petroleum… EIA
Here are stock levels for crude oil, gasoline and distillates compared with 5 year ranges, from the EIA: Crude and gasoline are doing their