
Here is a nice chart from Market Realist showing an inverse relationship between crude oil prices and implied volatility: Of course, the record

Record natural gas withdrawals… EIA
From the EIA’s Today in Energy: “During the recent cold weather event that affected much of the eastern United States, more natural gas was
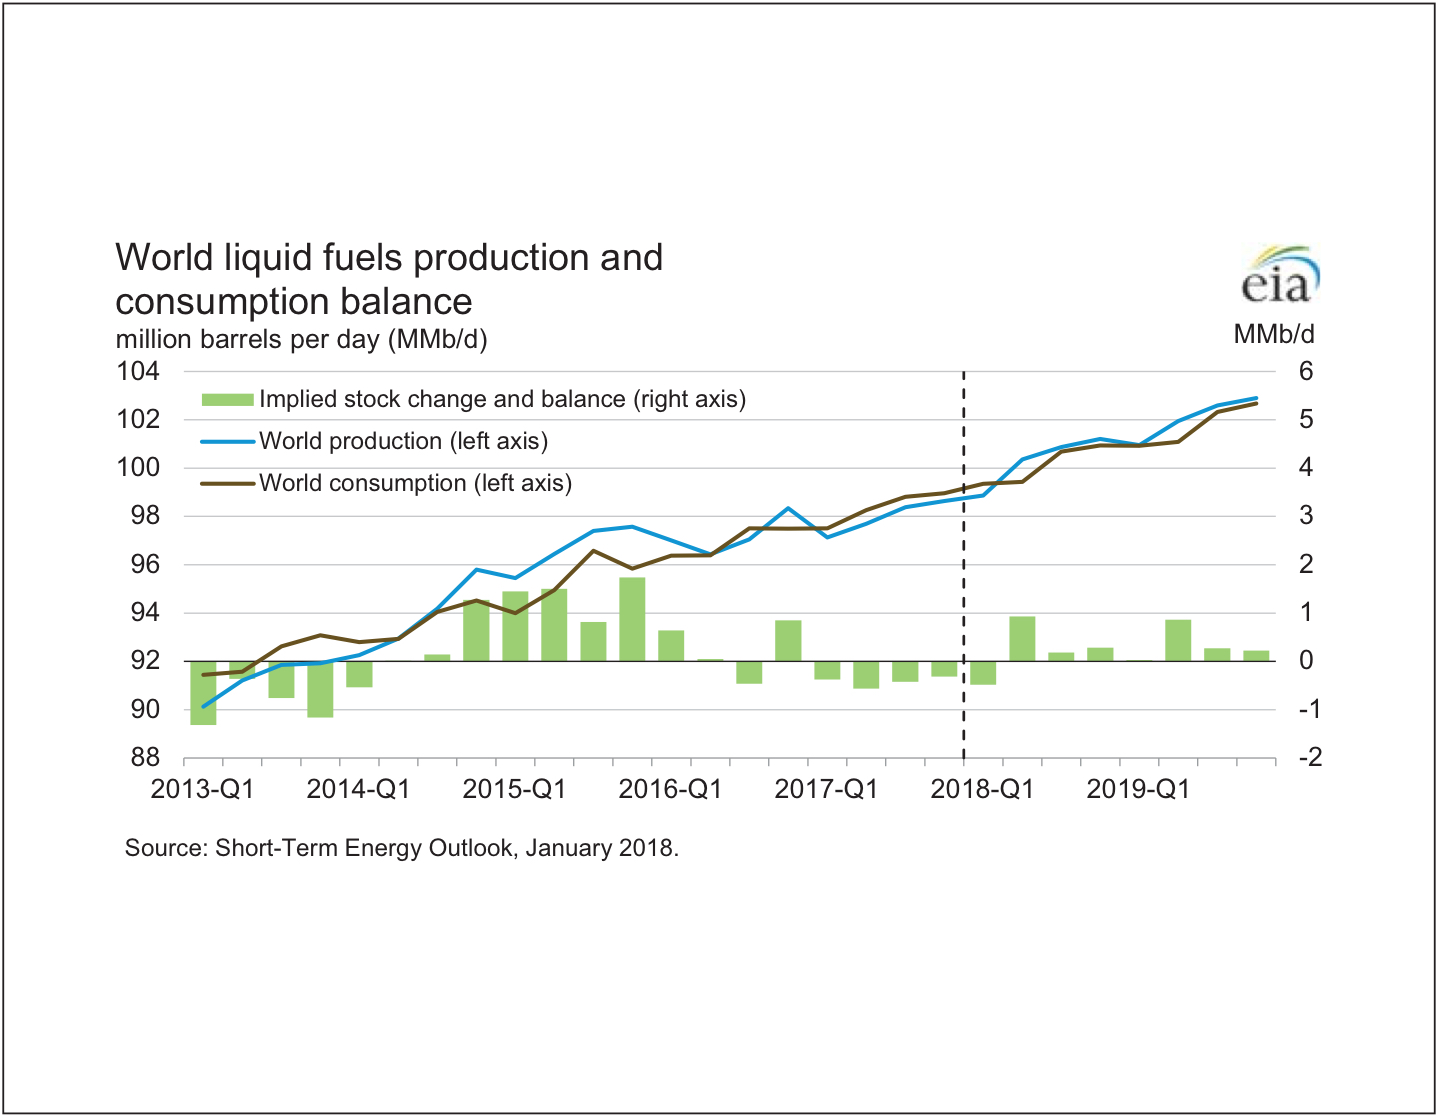
The EIA’s Short Term Energy Outlook…
There are lots of tasty morsels in the EIA’s monthly Short Term Energy Outlook, here are just a few: On WTI/Brent price spreads: ”EIA estimates

The Global Economy’s Output Gap Has Closed… WSJ/World Bank
Josh Zumbrun, WSJ, summarizes the World Bank’s Global Economic Prospects here... The 10-year note has noticed... Here are Tnote futures from
World stock markets.. The Economist
The Economist magazine has a feature called “Markets” where various stock markets from around the world are tallied... The most recent is as of

My Favorite Charts…Michael Batnick/The Irrelevant Investor
Michael Batnick put together an interesting chart book here... (here is the JP Morgan site with

Record natural gas demand… EIA
The EIA reports that Jan 1 set a new record for natural gas consumption: “Estimated U.S. natural gas demand on January 1, 2018 reached 150.7

One stat…
From the EIA’s “This Week in Petroleum”, refinery runs are up to an eye popping 17,608 barrels per day!!! The record based on weekly numbers is

New England Gas Prices Jump… WSJ
Here is Stephanie Yang in today’s Wall Street Journal: ”According to S&P Global Platts, New England next-day prices jumped to $38.40 a million