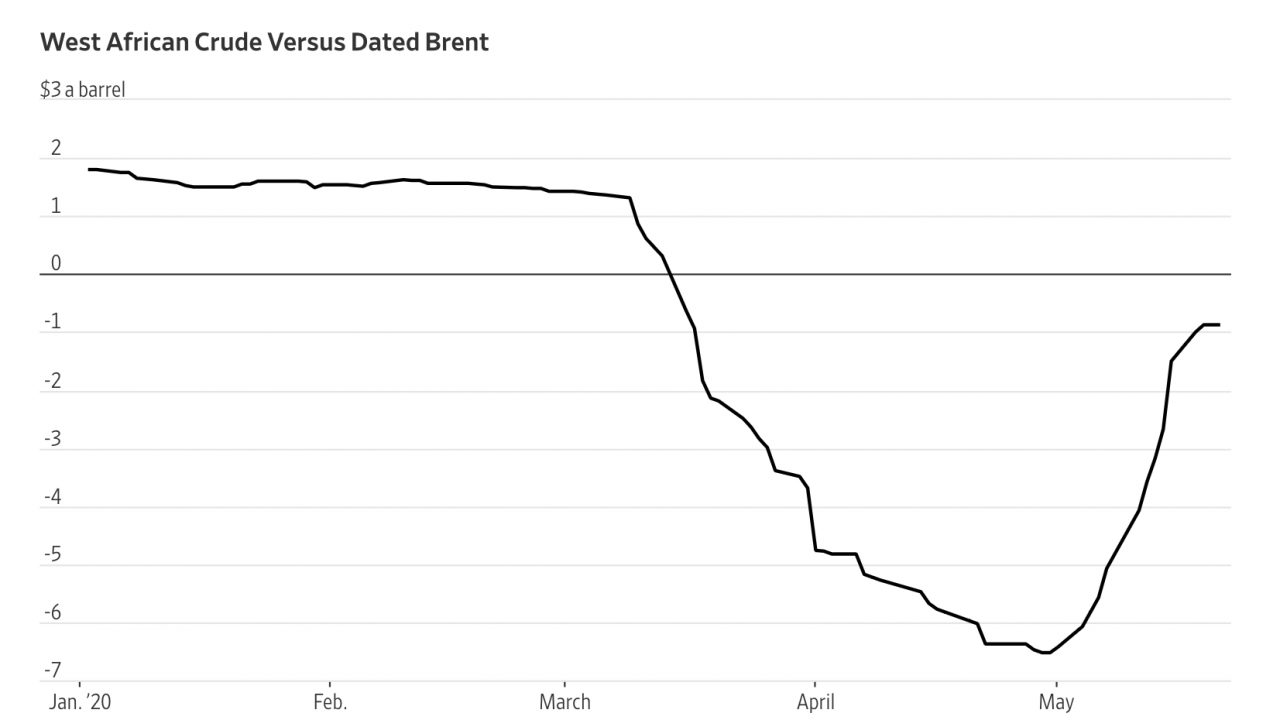
David Hodari, Wall Street Journal, explains the oil rally, here... ““We didn’t see tank tops at Cushing. Instead we’ve seen phenomenal levels of
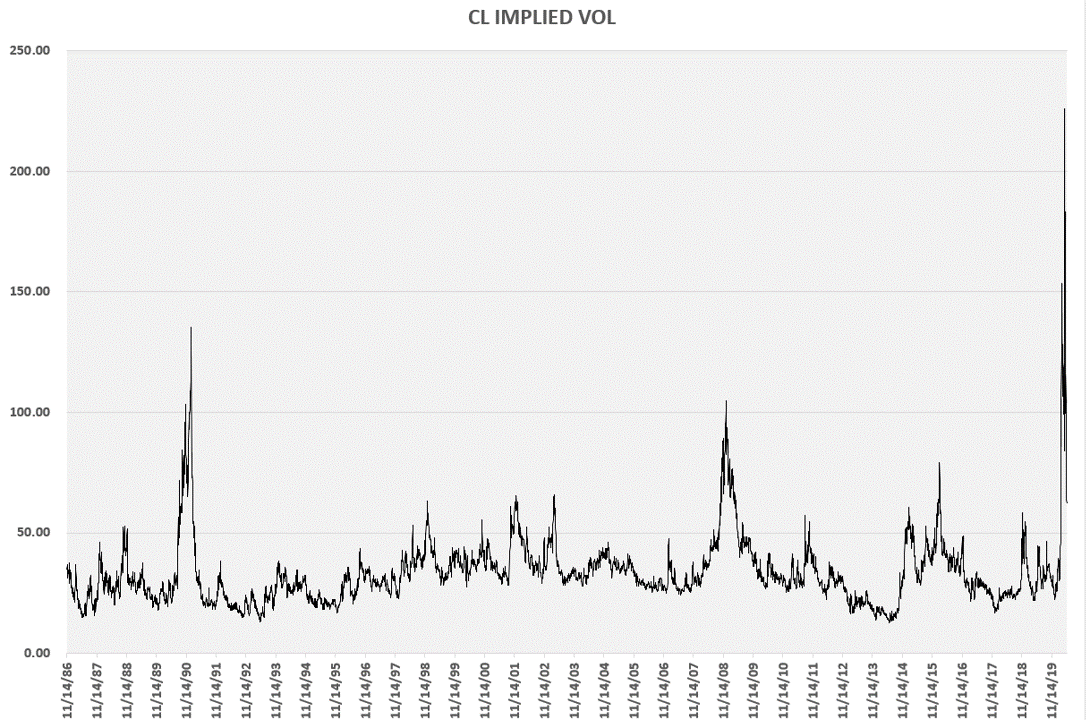
WTI implied vol update…
For perspective, here is my long term chart of implied volatility for WTI options (based on at the money, second nearby options)… No new normal, no
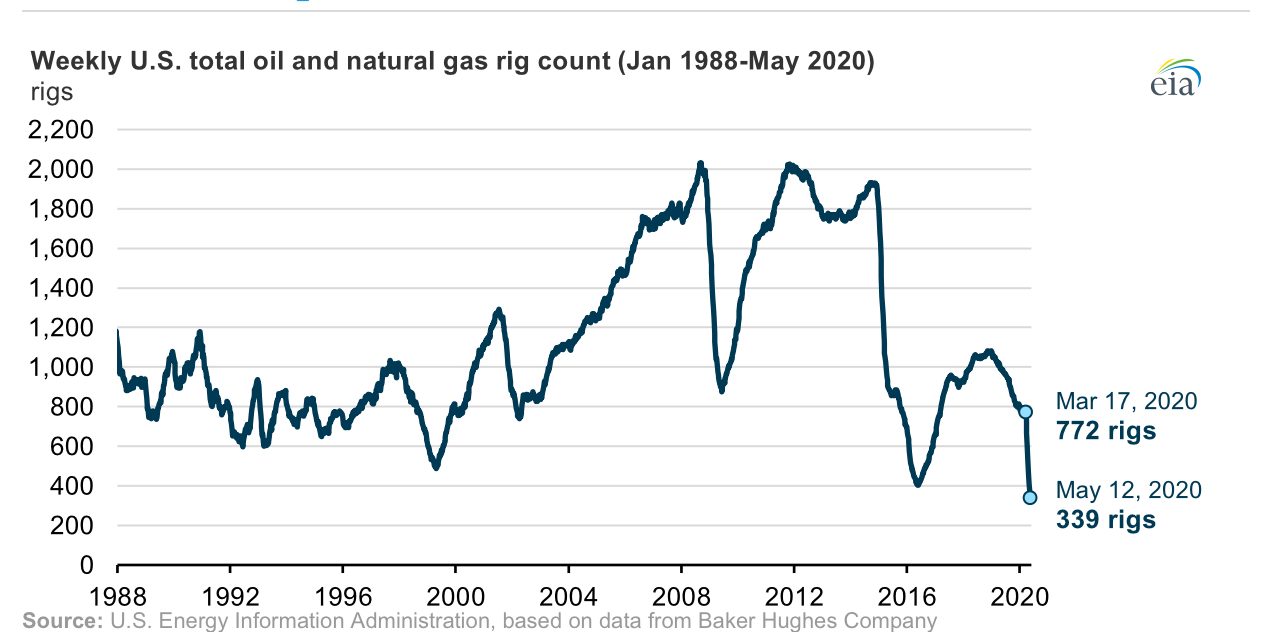
Active rigs in US at lowest on record… EIA
The EIA in Today in Energy focuses on US oil and gas rig counts, here... ”Changes in the number of oil rigs have historically followed changes in
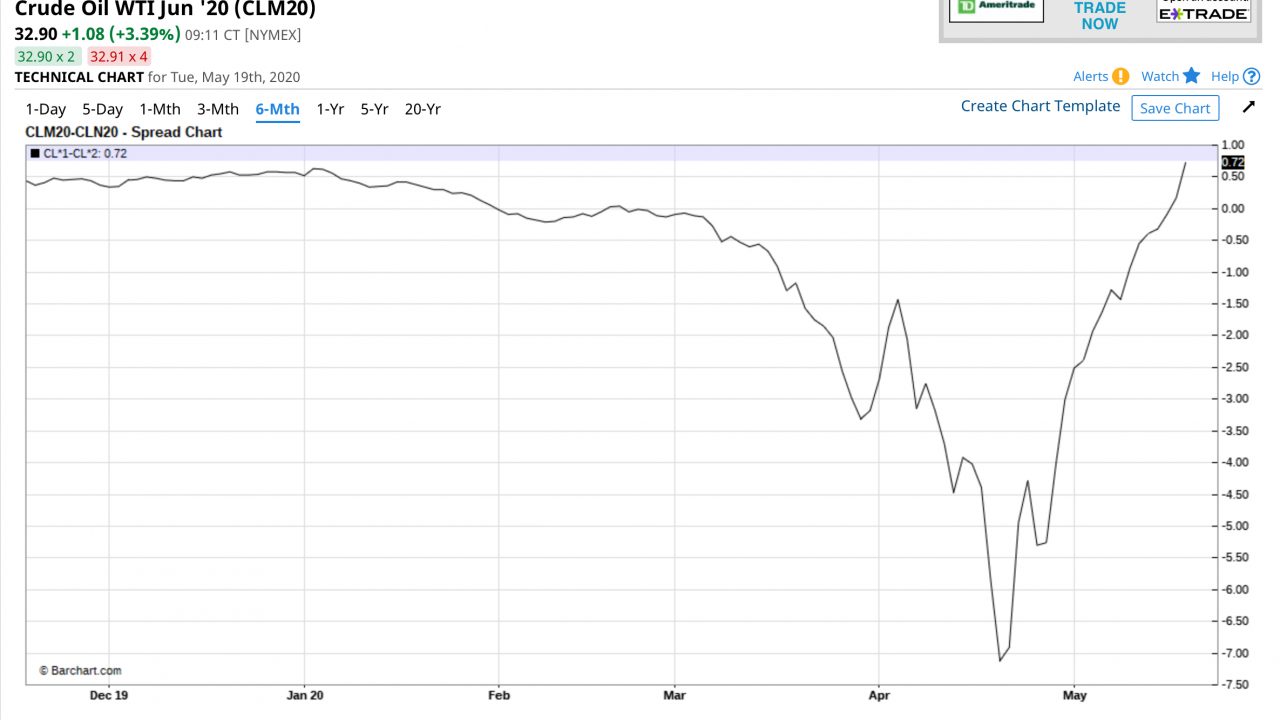
One month later…
What a difference a month makes... Here is a chart from Barchart.com showing the June/July WTI spread:
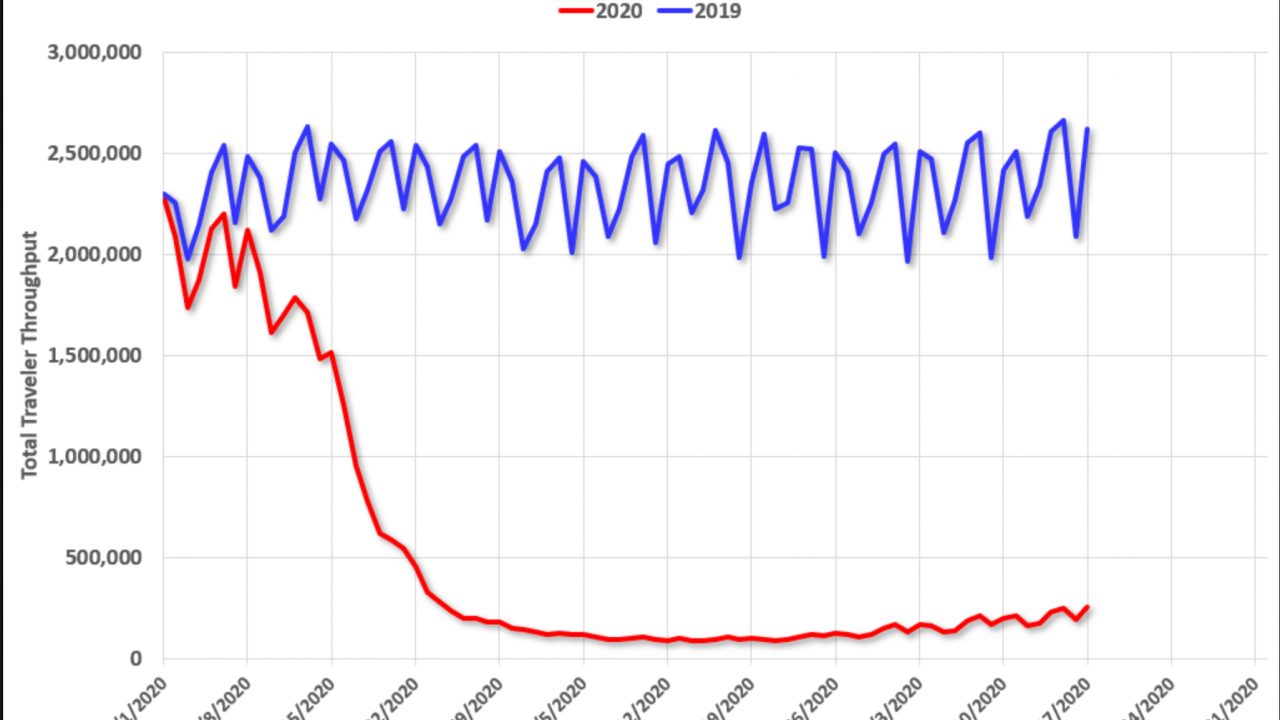
Six High Frequency Indicators… Calculated Risk
Calculated Risk has a nice post showing some economic indicators, here...
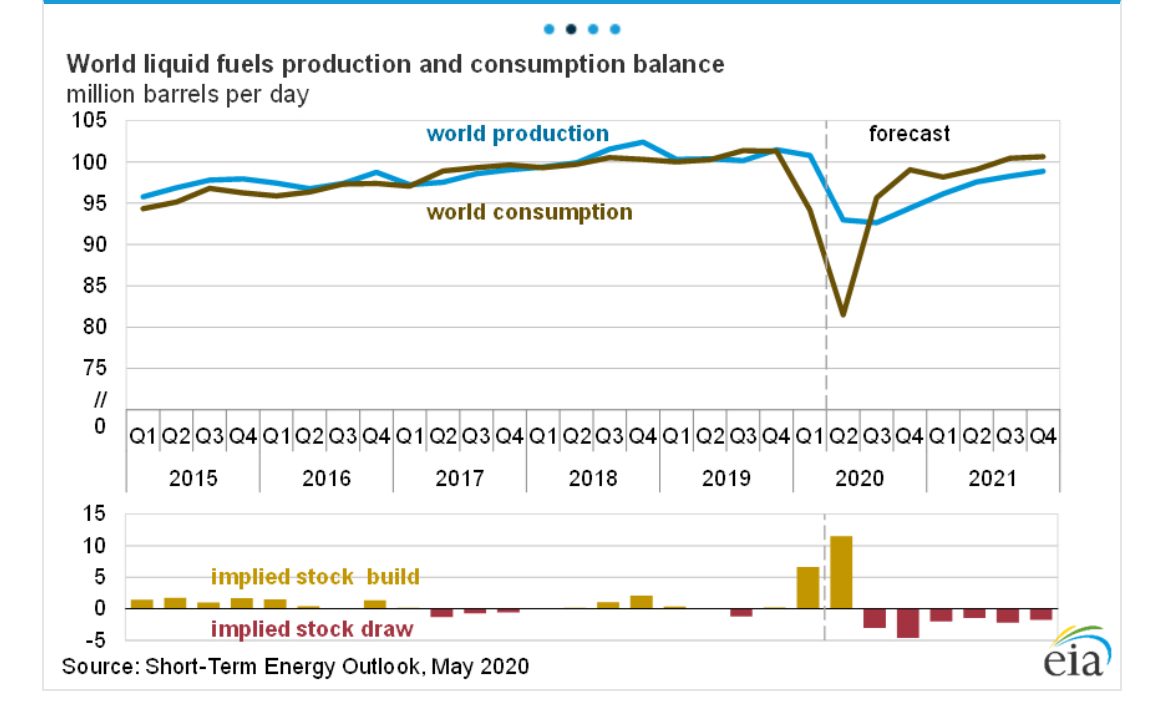
Supply/demand in a chart… EIA
This chart is from the EIA’s Short Term Energy report...
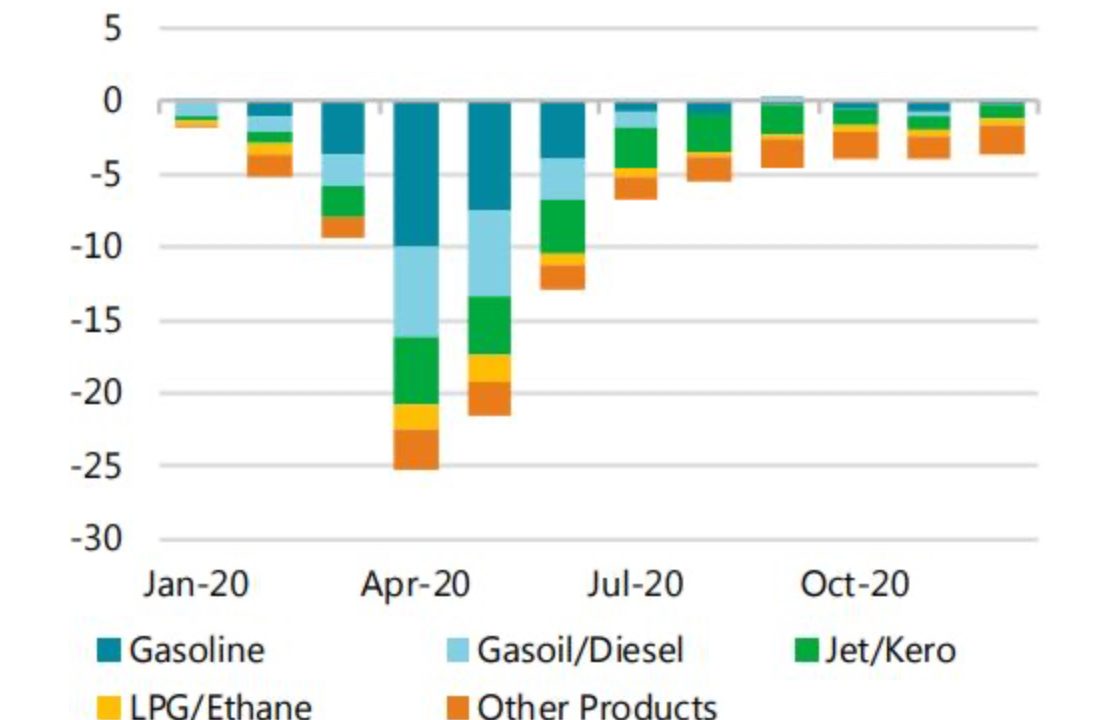
IEA’s Monthly Oil Report is out… IEA
Here are some highlights from the IEA’s Monthly Oil Report for May, released this morning (my bold): Better than expected mobility in OECD
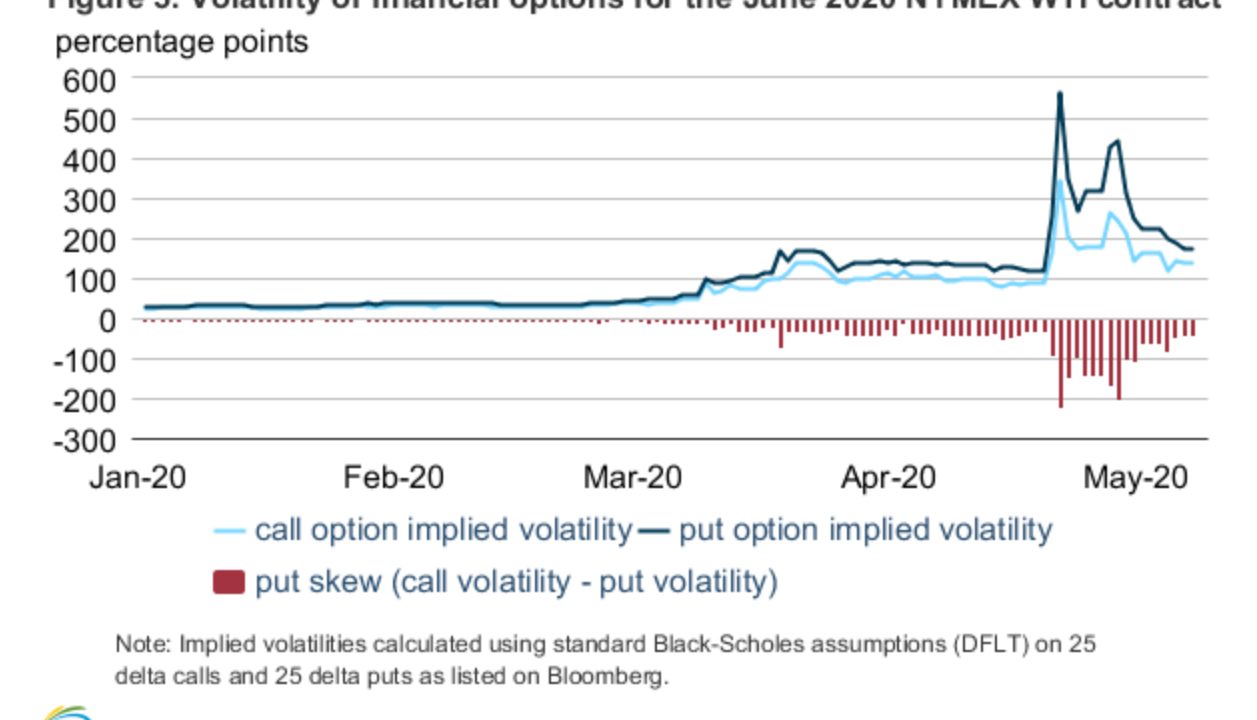
EIA looks at “skew”…
This month’s Short Term Energy Outlook includes a chart showing the skew in WTI options... using a Black-Scholes model! Once prices traded negative,
Podcast: May 2020 Oil Market Analysis
Commodity Research Group (CRG) is an independent research consultancy specializing in base and precious metals, as well energy products. The Group