
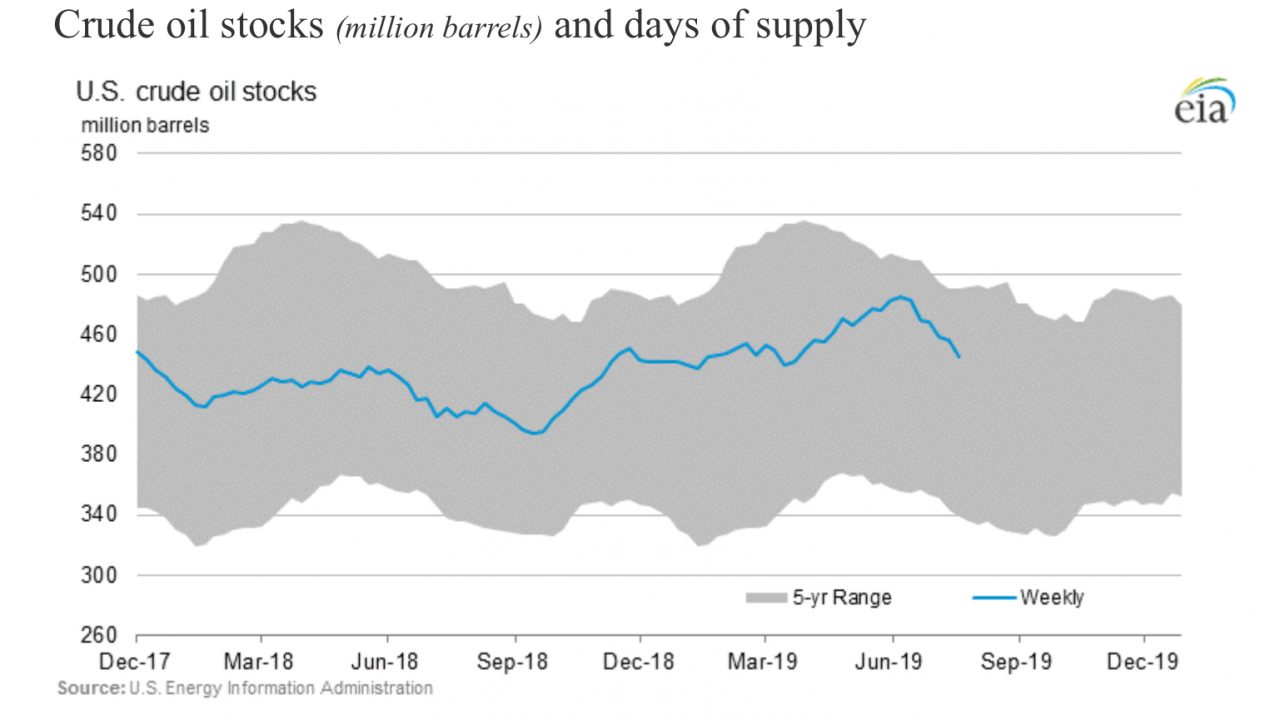
US crude stocks move toward 5 year averages, days supply toward last year’s numbers lead to sideways moving prices and declining volatility... (charts

US oil production continues to set record highs… EIA
From the EIA’s “This Week In Petroleum”, here: ”U.S. crude oil production averaged nearly 12.2 million barrels per day (b/d) in April 2019, an

Texas ranks first… EIA
In today’s edition “Today in Energy”, the EIA highlights installed wind capacity, here...
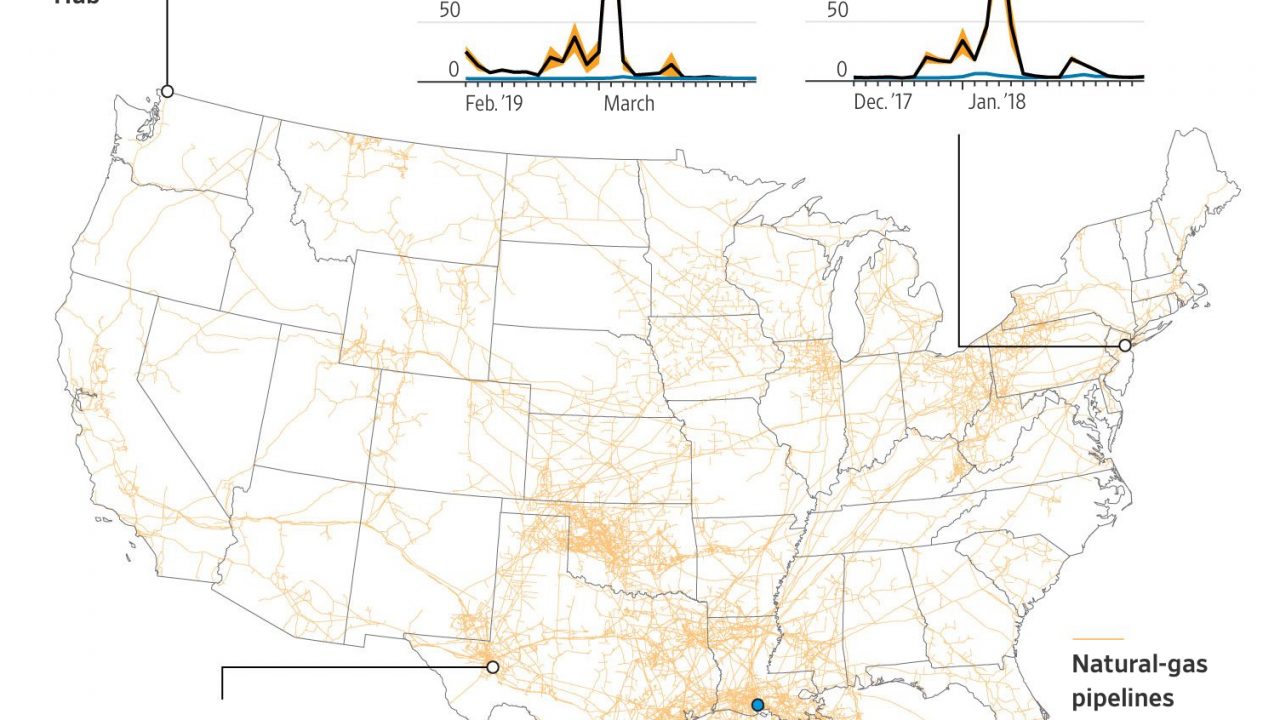
Not Everyone Can Get It… WSJ
Stephanie Yang and Ryan Dezember, Wall Street Journal, have an excellent piece from July 8th describing the difficulty in getting abundant natural gas
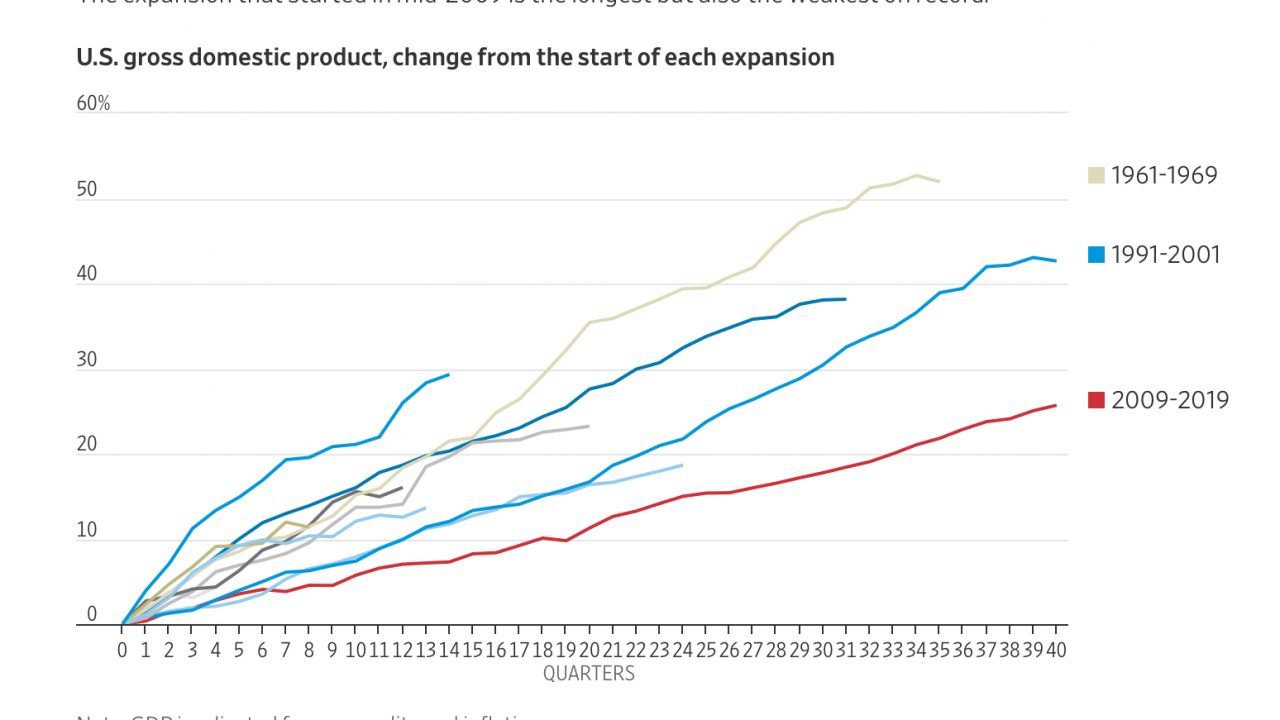
Longer not stronger… WSJ
Jeffrey Sparshott, Wall Street Journal, covers today’s GDP release, here... ”The expansion that started in mid-2009 is officially tied for the
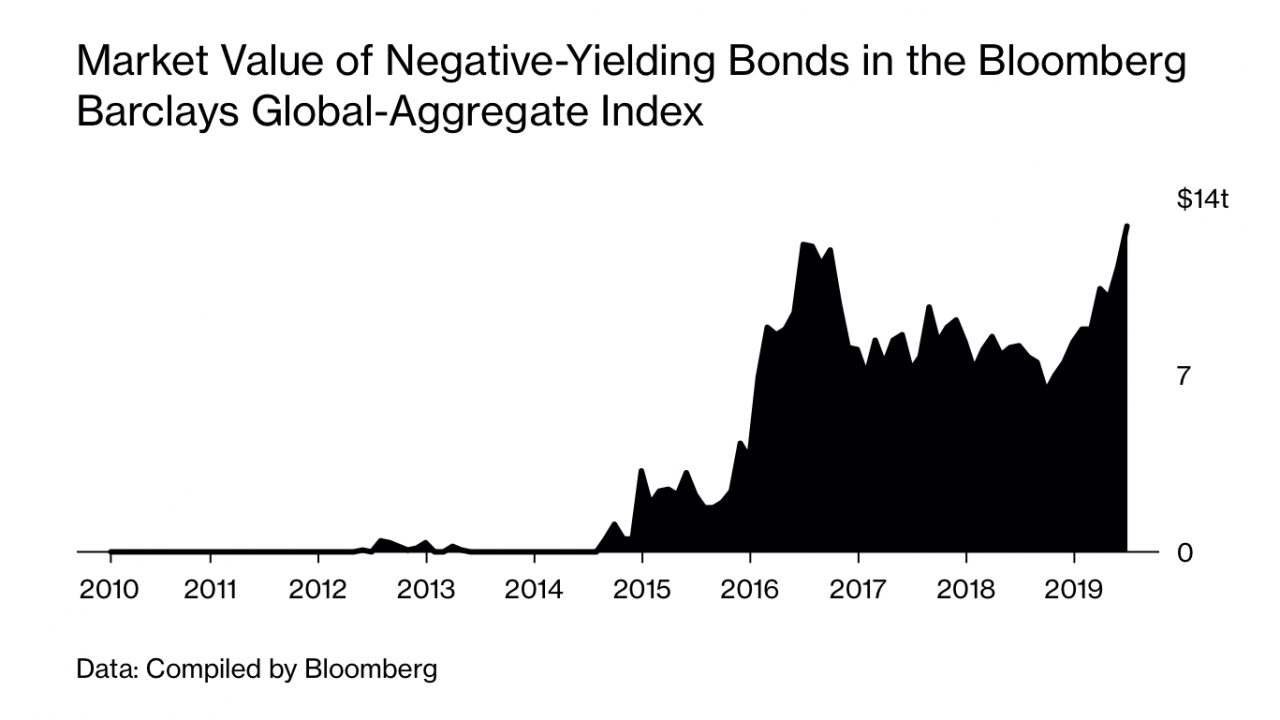
The Logic Behind the Bonds That Eat Your Money… Bloomberg
John Ainger, Bloomberg, discusses negative interest rates, here... “Negative-yielding bonds make up about a quarter of the investment-grade debt
Oil, distillate, gasoline stocks… EIA
From yesterday’s This Week In Petroleum, here are stock levels of crude oil, distillates and gasoline compared to 5 year average highs and lows:
Another excellent podcast by Jason Bordoff, Columbia Energy Exchange…
Jason Bordoff interviews Dr. Christof Ruhr, here... Highly recommended... ”Global energy markets are in flux, from the rapid growth in renewable
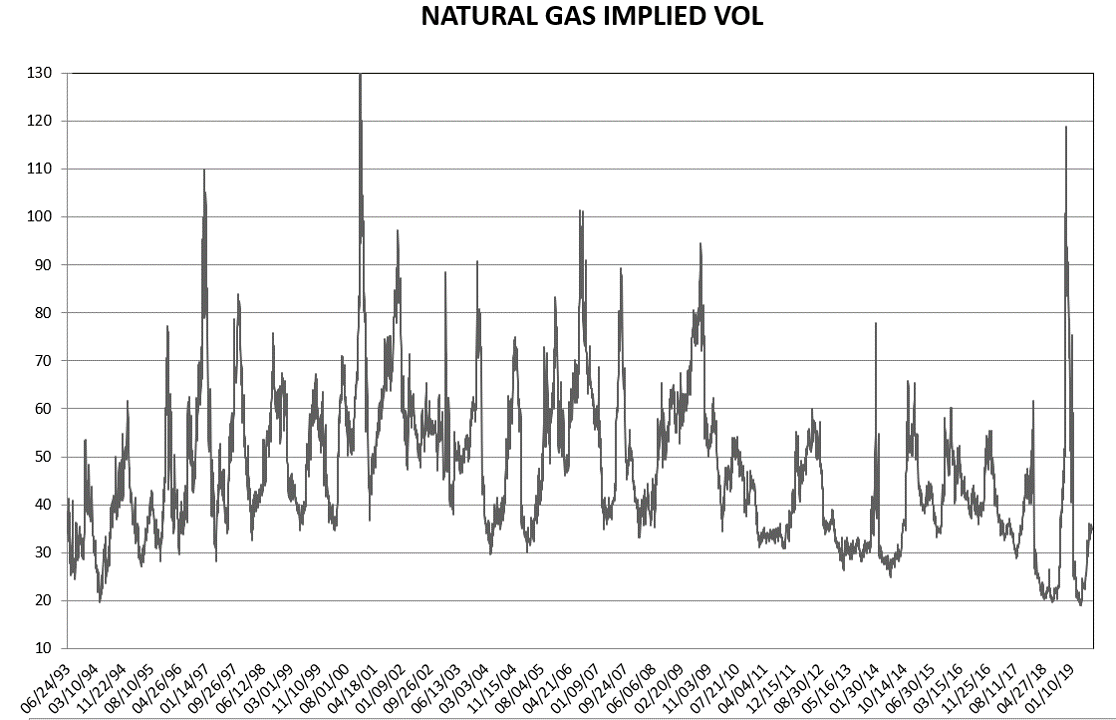
Natural gas options, long term implied vol…
Here is a long term chart of natural gas implied volatility.... I track mostly the second nearby, at the money option... The data go back to June of