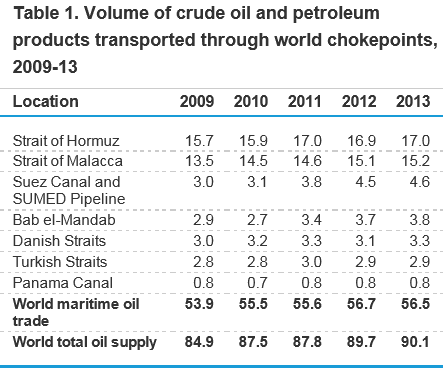
From the EIA, November 2014: http://www.eia.gov/beta/international/analysis_includes/special_topics/World_Oil_Transit_Chokepoints/wotc.pdf "Located
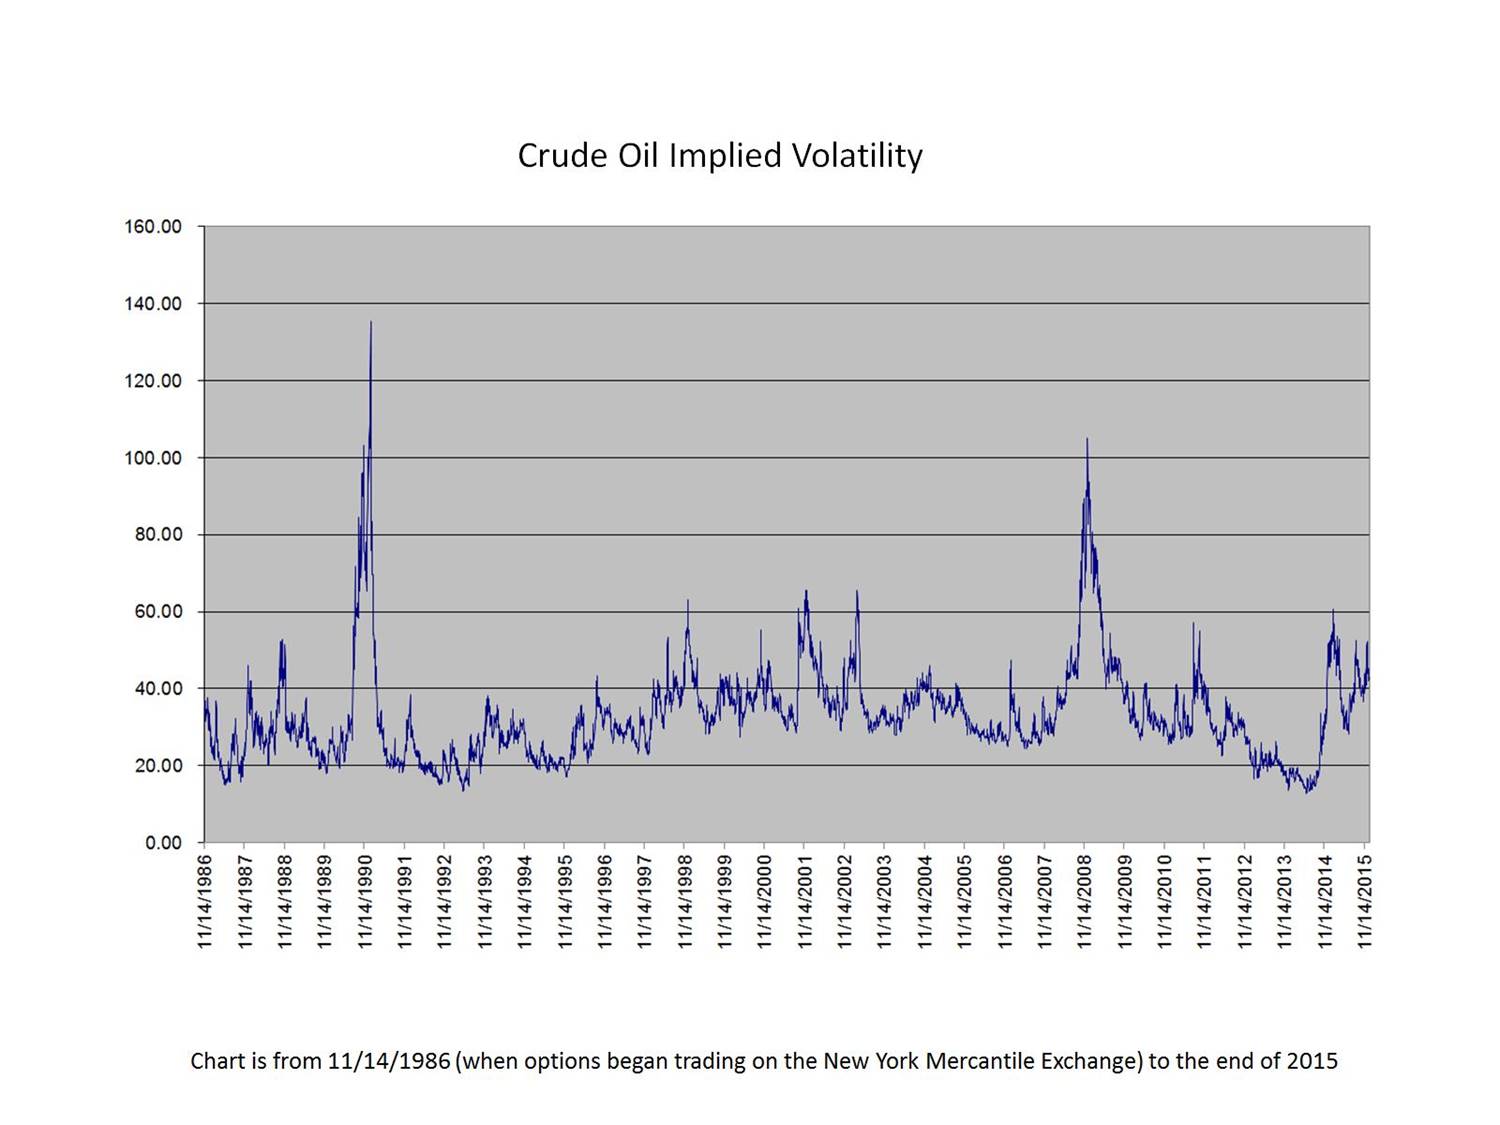
Crude Oil Implied Volatility (historical perspective)
Here is the all time implied vol chart for WTI since options began trading on November 14, 1986... The long term average is 32.9, with a high of 135.4