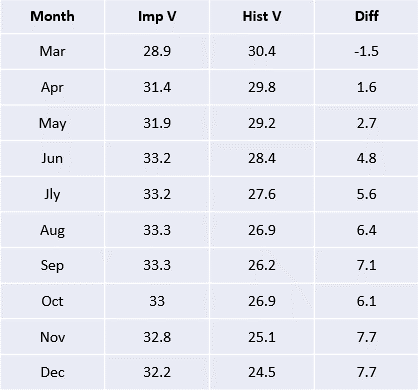
After listening to a CME podcast on oil options signaling long term uncertainty (what else is new), here, I did a shallow dive into what implied vols look like for the rest of the year… The table below shows implied volatility next to the 20 day historical measure for each month in 2019… Note that the curve is backwardated and flattens out later in the year… This is unusual but not unheard of… But notice how implied diverges from historical as we move into June and out to December… June, at 33.2%, and December, at 32%, are not a high numbers relative to history (the long term average is around 32,33% going back to 1986), but do seem elevated when compared with the front month (28.9) and historical vol (28.4,24.5)… Two scheduled events might be keeping option sellers in back months on the sidelines… First, the next OPEC meeting is scheduled for April 18th, which is just after the May option’s expiration on April 16th… And, the next decision on Iranian sanctions/waivers is also due after May options go off but before June… Also, we have mentioned the lack of volume in WTI options since mid-December in another post… Perhaps, there are fewer options sellers around in 2019 (many traders/hedge funds that blew out from extreme vol in natural gas may have been net sellers in crude options too…)… Are these markets super efficient pricing into option values all known information or have they lost a chunk of volume that employs a one way strategy (short vol) and perhaps become somewhat inefficient?
Leave a Reply