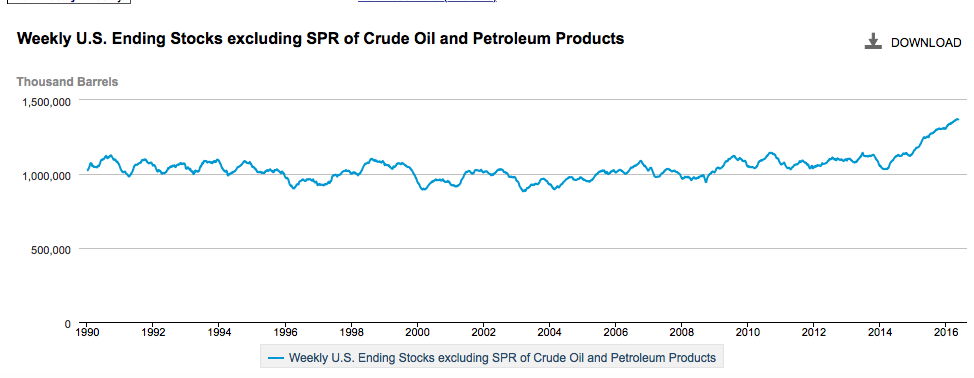
One of the most important fundamental indicators to us are total US stocks excluding the Strategic Petroleum Reserve. US petroleum inventories as the chart below indicates has been on an ever increasing upward slope since March 2014. In fact ,total US stocks have grown by 330 million barrels in this 26 month period or an astonishing 0.4 million barrels per day. Many analysts are pointing to the potential for a more normalization of inventory as we head toward the third quarter of 2016. As far as US total inventories are concerned as well as in terms of days supply we think they be right. Thus far,year to date total US stocks of crude and products have increased by roughly 50 million barrels or 0.38 mbd (very close to the 0.4 average rate of build since March 2014).
While stocks reached a record of 1.370 billion barrels in April,days supply (stocks/demand) indicates something entirely different. In fact in terms of days supply the supply situation was at its nadir in January and February when days supply at 69 days was an astounding 10 days over the previous four year average. Owing to a sharp increase in demand beginning later in February and continuing into early May,days supply are 67 days or narrowing to only 6 days over the four year average. The number still indicates a sizable surplus but an improvement over January’s figure no doubt. We think that total stocks are about to draw 50 million barrels from now until the end of September. Increasing crude runs,lower US crude production and imports are the major factors behind the stock draw. If we are correct, end September numbers will be at around 66 days supply or only 4 days above the four year average. We will still be in surplus but whittling down the bloat. There is some light at the end of the supply tunnel.
Leave a Reply