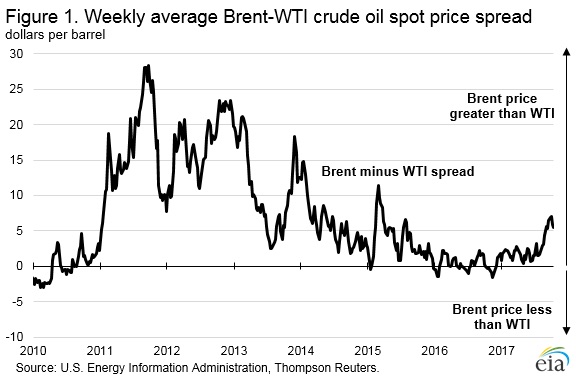
Here is a nice longer term chart of the Brent/WTI crude oil spread from the EIA’s This Week in Petroleum:
“Between 2011 and 2013, U.S. crude oil production grew faster than transportation, storage, and refining capacity could accommodate, and restrictions on exporting domestically produced crude oil resulted in WTI prices averaging $15 per barrel (b) below Brent (Figure 1).”
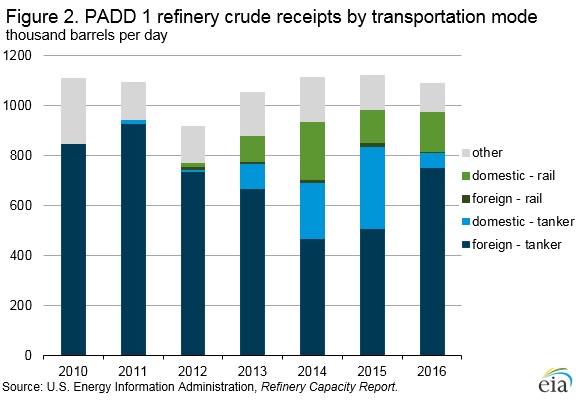
This chart shows the changing mix of crude oil destination for East Coast refiners:
Despite a sharp increase in US exports of crude oil, the Brent/WTI spread remains wide…

Leave a Reply